. 2022 Sep 10;5(1):946.
doi: 10.1038/s42003-022-03895-8.

Housing-temperature reveals energy intake counter-balances energy expenditure in normal-weight, but not diet-induced obese, male mice

Affiliations

Housing-temperature reveals energy intake counter-balances energy expenditure in normal-weight, but not diet-induced obese, male mice

Linu Mary John et al. Commun Biol. .

Abstract

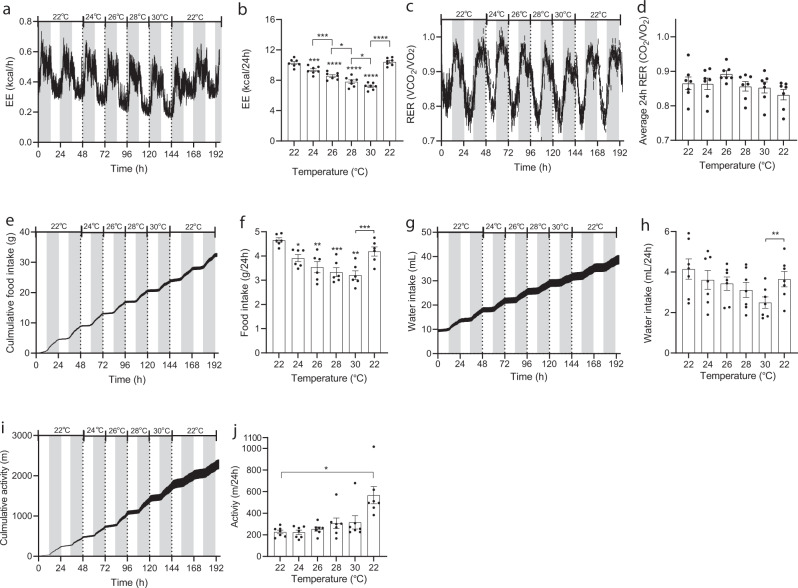
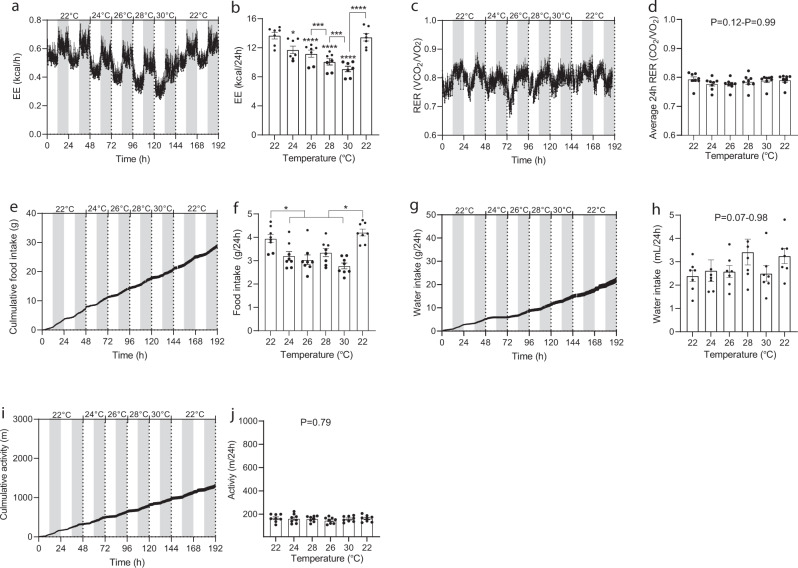
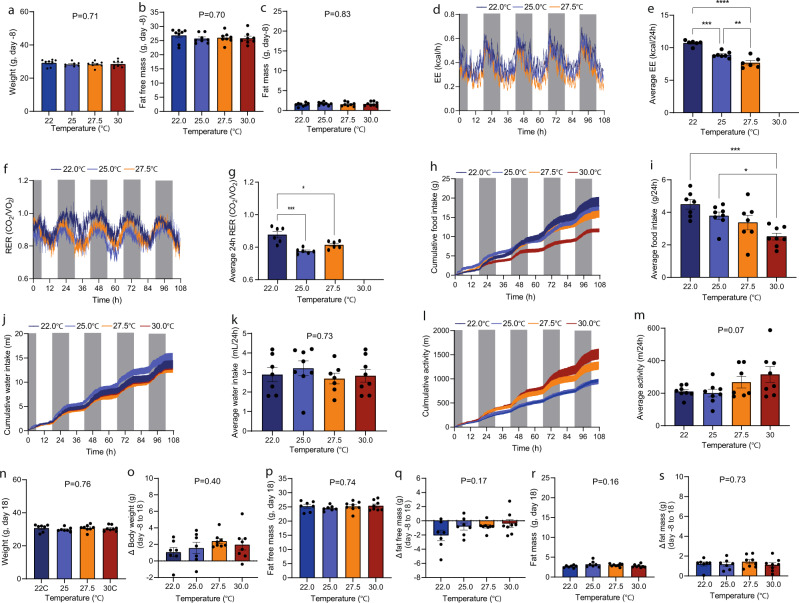
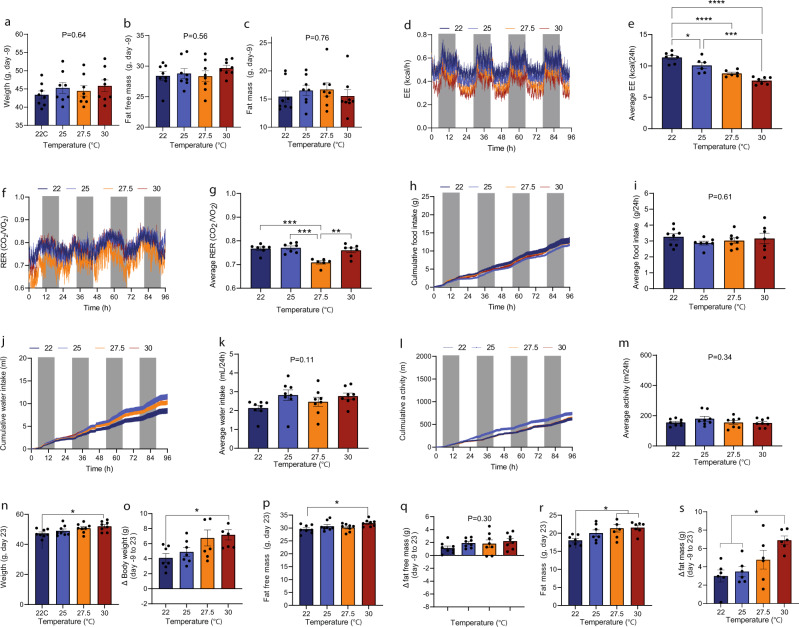
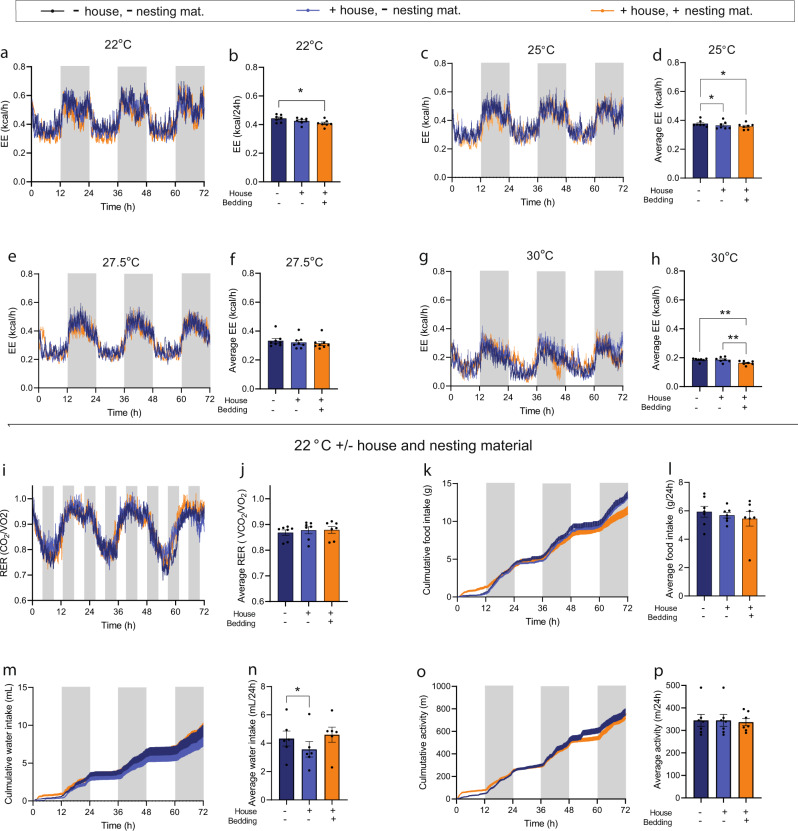
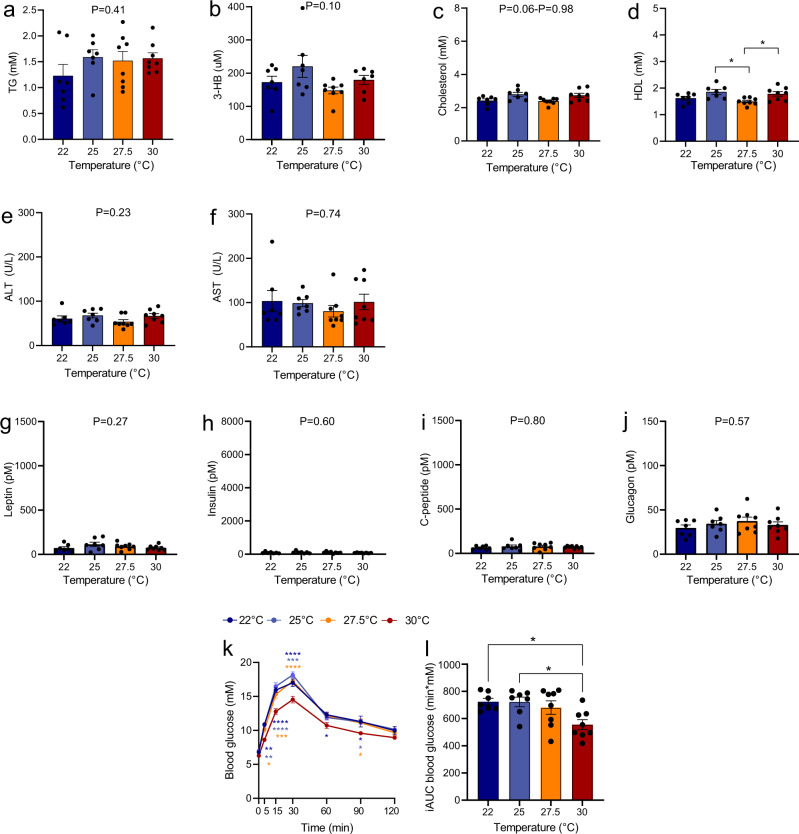
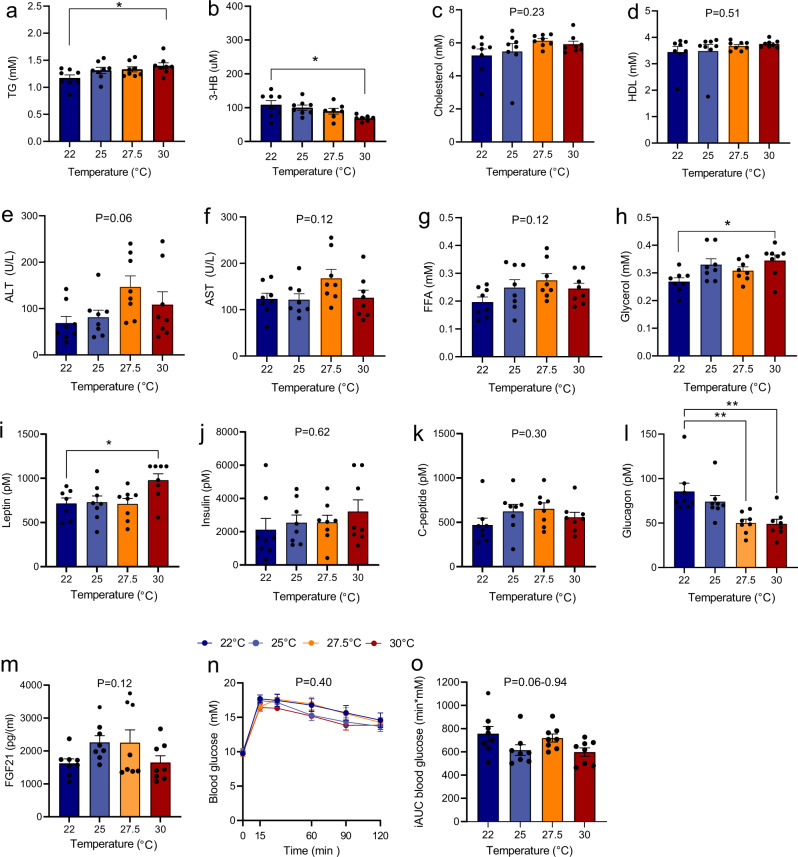
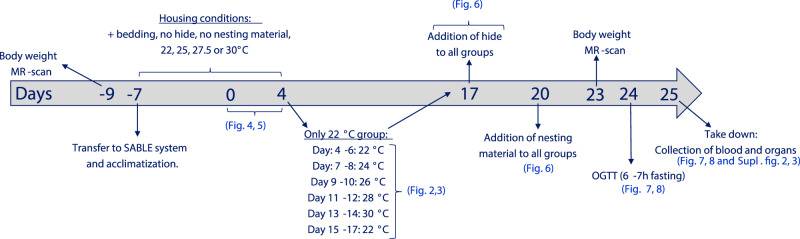
Most metabolic studies on mice are performed at room temperature, although under these conditions mice, unlike humans, spend considerable energy to maintain core temperature. Here, we characterize the impact of housing temperature on energy expenditure (EE), energy homeostasis and plasma concentrations of appetite- and glucoregulatory hormones in normal-weight and diet-induced obese (DIO) C57BL/6J mice fed chow or 45% high-fat-diet, respectively. Mice were housed for 33 days at 22, 25, 27.5, and 30 °C in an indirect-calorimetry-system. We show that energy expenditure increases linearly from 30 °C towards 22 °C and is ~30% higher at 22 °C in both mouse models. In normal-weight mice, food intake counter-balances EE. In contrast, DIO mice do not reduce food intake when EE is lowered. By end of study, mice at 30 °C, therefore, had higher body weight, fat mass and plasma glycerol and triglycerides than mice at 22 °C. Dysregulated counterbalancing in DIO mice may result from increased pleasure-based eating.


Conflict of interest statement

The authors declare the following competing interest: all authors are employed by Novo Nordisk (Denmark), and some are minor shareholders of Novo Nordisk stocks. All authors declare no competing interests that may be of relevance to this work.

Figures

Fig. 1
Fig. 1. Effect of housing temperature on energy expenditure, respiratory exchange ratio, food intake, water intake, and activity level in adult normal-weight male mice.
Male mice (C57BL/6J, 20 weeks, individually housed, n = 7) were housed in metabolic cages at 22 °C for a week preceding study initiation. After two days of collection of baseline data, temperature was increased in 2 °C increments each day at 0600 h (start of light phase). Data are presented as means ± SEM and dark phase (1800-0600h) is indicated with grey boxes. a Energy expenditure (kcal/h), b total energy expenditures at different temperatures (kcal/24 h), c Respiratory exchange ratios (VCO2/VO2: scale 0.7–1.0), d average RER (VCO2/VO2) during light and dark phase (zero-value defined as 0.7). e Cumulative food intakes (g), f total food intakes during 24 h, g cumulative water intake (mL), h Total water intakes during 24 h, i cumulative activity level (m), and j total activity levels (m/24 h). Mice were at the indicated temperatures for 48 h. Data shown for 24, 26, 28, and 30 °C are from the last 24 h of each period. Mice remained of chow throughout the study. Statistical significance was tested by One-way ANOVA for repeated measurements followed by Tukey multiple comparison test. Stars indicate significance from initial 22 °C values, hatches indicate significance between other groups as indicated. *P < 0.05, **P < 0.01, **P < 0.001, ****P < 0.0001. Averages were calculated over the entire experimental period (0–192 h). n = 7.
Fig. 2
Fig. 2. Effect of housing temperature on energy expenditure, respiratory exchange ratio, food intake, water intake, and activity level in adult normal-weight male mice and DIO male mice.
Male (C57BL/6J, 20 weeks) DIO mice were housed individually in metabolic cages at 22 °C for a week preceding study initiation. Mice had ad libitum access to 45% HFD. After acclimatization, baseline data was collected for two days. Hereafter, temperature was increased in 2 °C increments every other day at 0600 h (start of light phase). Data are presented as means ± SEM and dark phase (1800-0600h) is indicated with grey boxes. a Energy expenditure (kcal/h), b total energy expenditures at different temperatures (kcal/24 h), c respiratory exchange ratios (VCO2/VO2: scale 0.7–1.0), d average RER (VCO2/VO2) during light and dark phase (zero-value defined as 0.7). e Cumulative food intakes (g), f total food intakes during 24 h, g cumulative water intake (mL), h total water intakes during 24 h, i cumulative activity level (m), and j total activity levels (m/24 h). Mice were at the indicated temperatures for 48 h. Data shown for 24, 26, 28, and 30 °C are from the last 24 h of each period. Mice remained on 45% HFD until end of study. Statistical significance was tested by One-way ANOVA for repeated measurements followed by Tukey multiple comparison test. Stars indicate significance from initial 22 °C values, hatches indicate significance between other groups as indicated. *P < 0.05, ***P < 0.001, ****P < 0.0001. Averages were calculated over the entire experimental period (0–192 h). n = 7.
Fig. 3
Fig. 3. Expenditure, respiratory exchange ratio, food intake, water intake, and activity level in adult normal-weight male mice matched on age, weight, fat, and normal-weight mass.
Weight (a), Fat free mass (b), and fat mass (c) at -8 day (the day before transfer to SABLE system). d Energy expenditure (kcal/h). e Average energy expenditures (0–108 h) at different temperatures (kcal/24 h). f Respiratory exchange ratios (RER) (VCO2/VO2). g Average RER (VCO2/VO2). h Cumulative food intakes (g). i Average food intakes (g/24 h). j Cumulative water intake (mL). k Average water intake (mL/24 h). l Cumulative activity level (m). m Average activity level (m/24 h). n Weight at day 18, o changes in weight (from day -8 to 18), p fat free mass at day 18, q changes in fat free mass (from day -8 to 18), r fat mass at day 18, and s changes in fat mass (from day -8 to day 18). Statistical significance was tested by Oneway-ANOVA for repeated measurements followed by Tukey multiple comparison test. *P < 0.05, **P < 0.01, ***P < 0.001, ****P < 0.0001. Data are presented as means + SEM and dark phase (1800-0600h) is indicated with grey boxes. Dots in bar graphs indicate individual mice. Averages were calculated over the entire experimental period (0–108 h). n = 7.
Fig. 4
Fig. 4. Effect of housing temperature on energy expenditure, respiratory exchange ratio, food intake, water intake, and activity level in mid-old DIO male mice.
Weight (a), fat free mass (b), and fat mass (c) at -9 day (the day before transfer to SABLE system). d Energy expenditure (EE, kcal/h). e Average energy expenditures (0–96 h) at different temperatures (kcal/24 h). f Respiratory exchange ratios (RER, VCO2/VO2). g Average RER (VCO2/VO2). h Cumulative food intake (g). i Average food intake (g/24 h). j Cumulative water intake (mL). k Average water intake (mL/24 h). l Cumulative activity level (m). m Average activity level (m/24 h). n weight (g) at day 23, o change in body weight; day 23 compared to day -9, p fat free mass at day 23, q change in fat free mass (g); day 23 compared to day -8, r fat mass (g) at day 23, s change in fat mass (g), day 23 compared to day -8. Statistical significance was tested by Oneway-ANOVA for repeated measurements followed by Tukey multiple comparison test. *P < 0.05, ***P < 0.001, ****P < 0.0001. Data are presented as means + SEM and dark phase (1800-0600h) is indicated with grey boxes. Dots in bar graphs indicate individual mice. Averages were calculated over the entire experimental period (0–96 h). n = 7.
Fig. 5
Fig. 5. Importance of houses and nesting material for expenditure, respiratory exchange ratio, food intake, water intake, and activity level in mid-old normal-weight and DIO male mice.
Data from mice housed hide and nesting material (dark blue), with house but without nesting material (light blue), and with house and with nesting material (orange). a, c, e, and g Energy expenditure (EE,kcal/h) at housing at 22, 25, 27.5, and 30 °C, b, d, f, and h average EE (kcal/h). ip Data from mice housed at 22 °C: i Respiratory exchange ratio (RER, VCO2/VO2), j Average RER(VCO2/VO2), k cumulative food intake (g), l average food intake (g/24 h), m Cumulative water intake (mL), n average water intake AUCs (mL/24 h), o cumulative activity (m), p average activity level (m/24 h). Data are presented as means + SEM and dark phase (1800-0600h) is indicated with grey boxes. Dots in bar graphs indicate individual mice. Statistical significance was tested by Oneway-ANOVA for repeated measurements followed by Tukey multiple comparison test. *P < 0.05, **P < 0.01. Averages were calculated over the entire experimental period (0–72 h). n = 7.
Fig. 6
Fig. 6. Effect of housing temperature on fasting plasma concentrations of lipids, ketone bodies, hepatic inflammatory markers, gluco- and appetite-regulating hormones, and glucose tolerance after an oral glucose in normal-weight mice.
Plasma concentrations of TG, 3-HB, cholesterol, HDL, ALT, AST, FFA, glycerol, leptin, insulin, C-peptide, and glucagon are shown in adult DIO male mice (al) after 33 days of housing at the indicated temperatures. Mice had been fasted 2–3 h prior to collection of blood. The oral glucose tolerance test is an exception to this as it was performed two days before study end on mice that had been fasted 5–6 h and housed 31 days at the respective temperatures. Mice were challenged with 2 g/kg body weight. Area under the curve data (L) are presented as incremental data (iAUCs). Data are presented as means ± SEM. Dots indicate individual samples. *P < 0.05, **P < 0.01, **P < 0.001, ****P < 0.0001, n = 7.
Fig. 7
Fig. 7. Effect of housing temperature on fasting plasma concentrations of lipids, ketone bodies, hepatic inflammatory markers, gluco- and appetite-regulating hormones, and glucose tolerance after an oral glucose.
Plasma concentrations of TG, 3-HB, cholesterol, HDL, ALT, AST, FFA, glycerol, leptin, insulin, C-peptide, glucagon, and FGF21 are shown in adult DIO male mice (ao) after 33 days of housing at the indicated temperatures. Mice had been fasted 2–3 h prior to collection of blood. The oral glucose tolerance test is an exception to this as it was performed two days before study end on mice that had been fasted 5–6 h and housed 31 days at the respective temperatures Mice were challenged with 2 g/kg body weight. Area under the curve data (o) are shown as incremental data (iAUCs). Data are presented as means ± SEM. Dots indicate individual samples. *P < 0.05, **P < 0.01, **P < 0.001, ****P < 0.0001, n = 7.
Fig. 8
Fig. 8. Study design.
Normal-weight and DIO mice followed same study procedure. At day -9, mice were weighted and MR-scanned and allocated into groups matched on weight and body composition. At day -7 mice were transferred into a closed temperature controlled indirect calometry system from SABLE Systems International (NV, USA). Mice were single housed with bedding but without hide and nesting material. The temperature was either set to 22, 25, 27.5, or 30 °C. After a week of acclimatization (day -7 to day 0, no handling of animals), data was collected for four consecutive days (day 0–4, data presented in Figs. 1, 2, 5). Hereafter, the mice housed at 25, 27.5, and 30 °C was left at unaltered conditions until day 17. Meanwhile, the temperature in the 22 °C group was increased in 2 °C intervals every other day, adjusting temperature at start of light cycle (0600 h) (data are presented in Fig. 1). At day 15, temperature was lowered to 22 °C and data was collected for two days to provide a baseline data for following procedures. At day 17, a hide was added to all mice, and nesting material was added at day 20 (Fig. 5). At day 23, mice were weighted and MR-scanned and were thereafter left undisturbed for 24 h. At day 24, mice were fasted from start of light cycle (0600 h) and were subjected to an OGTT (2 g/kg) at 1200 h (6–7 h fasted). Mice were thereafter returned to their respective housing conditions in the SABLE system and were euthanized the following day (day 25).

References

    1. Nilsson C, Raun K, Yan FF, Larsen MO, Tang-Christensen M. Laboratory animals as surrogate models of human obesity. Acta Pharmacol. Sin. 2012;33:173–181. doi: 10.1038/aps.2011.203. - DOI - PMC - PubMed
    1. Gilpin DA. Calculation of a new Meeh constant and experimental determination of burn size. Burns. 1996;22:607–611. doi: 10.1016/S0305-4179(96)00064-2. - DOI - PubMed
    1. Gordon CJ. The mouse thermoregulatory system: Its impact on translating biomedical data to humans. Physiol. Behav. 2017;179:55–66. doi: 10.1016/j.physbeh.2017.05.026. - DOI - PMC - PubMed
    1. Fischer AW, Csikasz RI, von Essen G, Cannon B, Nedergaard J. No insulating effect of obesity. Am. J. Physiol. Endocrinol. Metab. 2016;311:E202–E213. doi: 10.1152/ajpendo.00093.2016. - DOI - PubMed
    1. Lee P, et al. Temperature-acclimated brown adipose tissue modulates insulin sensitivity in humans. Diabetes. 2014;63:3686–3698. doi: 10.2337/db14-0513. - DOI - PMC - PubMed