. 2022 Sep 10;13(1):5328.
doi: 10.1038/s41467-022-32847-3.

Wilkes subglacial basin ice sheet response to Southern Ocean warming during late Pleistocene interglacials

Affiliations

Wilkes subglacial basin ice sheet response to Southern Ocean warming during late Pleistocene interglacials

Ilaria Crotti et al. Nat Commun. .

Erratum in

Abstract

The response of the East Antarctic Ice Sheet to past intervals of oceanic and atmospheric warming is still not well constrained but is critical for understanding both past and future sea-level change. Furthermore, the ice sheet in the Wilkes Subglacial Basin appears to have undergone thinning and ice discharge events during recent decades. Here we combine glaciological evidence on ice sheet elevation from the TALDICE ice core with offshore sedimentological records and ice sheet modelling experiments to reconstruct the ice dynamics in the Wilkes Subglacial Basin over the past 350,000 years. Our results indicate that the Wilkes Subglacial Basin experienced an extensive retreat 330,000 years ago and a more limited retreat 125,000 years ago. These changes coincide with warmer Southern Ocean temperatures and elevated global mean sea level during those interglacial periods, confirming the sensitivity of the Wilkes Subglacial Basin ice sheet to ocean warming and its potential role in sea-level change.


Conflict of interest statement

The authors declare no competing interests.

Figures

Fig. 1
Fig. 1. Location of main Antarctic ice core drilling sites and the marine sediment core at Site U1361.
The map shows the subglacial bedrock elevation above sea level (colour scale, m) and the Antarctic ice sheet present-day surface elevation above sea level (contours, m). The ice core drilling sites of Talos Dome (TD), Dome C (DC), Vostok (VK), and Dome F (DF) and the marine sediment core at Site U1361 are indicated with blue dots. The studied area of the Wilkes Subglacial Basin is delimited by the red dashed contour. Map created using the Quantarctica GIS package developed by the Norwegian Polar Institute and published under the Creative Commons Attribution 4.0 International License.
Fig. 2
Fig. 2. Compilation of Talos Dome ice core (TALDICE) and Epica Dome C ice core (EDC) sea-salt sodium fluxes, d-excess, and δ18O records over the last four interglacial periods.
For all the proxies, the resampled records at 200 year intervals (blue curves for EDC and red curves for TALDICE) are superimposed on the raw signals (light blue curves for EDC and pink curves for TALDICE). a EDC, and TALDICE, ssNa+ fluxes on logarithmic scale. TALDICE ssNa+ fluxes for Marine Isotopic Stage (MIS) 7.5 and 9.3 are from this study. b EDC and TALDICE d-excess records. TALDICE d-excess records for MIS 5.5, 7.5, and 9.3 are from this study. c EDC, , and TALDICE, δ18O records. TALDICE δ18O data for MIS 7.5 and 9.3 are from this study. The anomalies in the TALDICE δ18O record are identified by grey shaded bars (marking the start and end of the anomalous increase in δ18O values).
Fig. 3
Fig. 3. Comparison of the Talos Dome ice core (TALDICE) isotopic record to Grenoble Ice Sheet and Land Ice (GRISLI) simulations, sedimentological data from sediment core U1361A, and Antarctic atmospheric and oceanic temperature records since 350 ka.
a Antarctic ice core temperature difference (ΔT, difference from mean values of the last millennium) derived from δD at Epica Dome C (EDC) plotted on the Antarctic Ice Core Chronology 2012 (AICC2012) and 65°S summer insolation (grey curve). b TALDICE normalized δ18O record (data centred and scaled to have mean 0 and standard deviation 1) (measured, pink; resampled at 200 year intervals, red). Holocene data are from Stenni et al. and Marine Isotopic Stage (MIS) 5.5 data are from Masson-Delmotte et al.. The MIS 7.5 and MIS 9.3 isotopic data are from this study. c Talos Dome (TD) and Dome C (DC) elevation from Glacial Start (GS) simulations, based on the original oceanic forcing used by Quiquet et al., and the original forcing increased by 5% and by 10%. d Wilkes Subglacial Basin ice volume evolution from GS simulations. e Core U1361A Nd isotope record (plotted as εNd; green curve with dots with their respective standard deviation) and iceberg-rafted debris (IBRD) % (brown curve with dots) on AICC2012 age scale (see Methods). f North Atlantic bottom water temperatures (°C) derived from the Ocean Drilling Program (ODP) 980 δ18O benthic foraminifera record used to derive the GRISLI oceanic forcing. Grey bars highlight the intervals with a unique isotopic signal in the TALDICE ice core compared to the EDC record.
Fig. 4
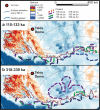
Fig. 4. Interglacial grounding line retreat of the Wilkes Subglacial Basin ice sheet simulated by the Grenoble Ice Sheet and Land Ice (GRISLI) GS-5 experiment at three different time intervals at 40 km resolution.
a Grounding line displacement during Marine Isotopic Stage (MIS) 5.5 at 133 ka (blue dashed line), 128 ka (green dashed line) and 115 ka (purple dashed line). b Grounding line displacement during MIS 9.3 at 339 ka (blue dashed line), 332 ka (green dashed line) and 318 ka (purple dashed line). The map also shows the subglacial bedrock elevation above sea level (colour shading, m), the Antarctic ice sheet present-day surface elevation above sea level (contours, m), and the present-day grounding line position (red dashed line). Map created using the Quantarctica GIS package developed by the Norwegian Polar Institute and published under the Creative Commons Attribution 4.0 International License.
Fig. 5
Fig. 5. Identification of change points and anomalies in the Talos Dome ice core (TALDICE) in comparison to EPICA Dome C ice core (EDC).
The original TALDICE and EDC δ18O records were normalized (pink and light blue, respectively) and then resampled with a 200 year time step (red and dark blue, respectively). Change points in the TALDICE record (grey bars) are identified where the record shows a change in slope (dashed black lines). Anomalies are calculated based on the differences in values in the resampled record between the two change points.

References

    1. Edwards TL, et al. Projected land ice contributions to twenty-first-century sea level rise. Nature. 2021;593:74–82. - PubMed
    1. Adusumilli, S., Fricker, H. A., Medley, B., Padman, L. & Siegfried, M. R. Interannual variations in meltwater input to the Southern Ocean from Antarctic ice shelves. Nat. Geosci. 13, 616–620 (2020). - PMC - PubMed
    1. Rignot E, et al. Four decades of Antarctic ice sheet mass balance from 1979–2017. Proc. Natl Acad. Sci. USA. 2019;116:1095–1103. - PMC - PubMed
    1. Pollard D, DeConto RM. Modelling West Antarctic ice sheet growth and collapse through the past five million years. Nature. 2009;458:329–332. - PubMed
    1. Turney CSM, et al. Early Last Interglacial ocean warming drove substantial ice mass loss from Antarctica. Proc. Natl Acad. Sci. USA. 2020;117:3996–4006. - PMC - PubMed

Publication types