. 2022 Sep 10;13(1):5324.
doi: 10.1038/s41467-022-33063-9.

Functional genomics uncovers the transcription factor BNC2 as required for myofibroblastic activation in fibrosis

Affiliations

Functional genomics uncovers the transcription factor BNC2 as required for myofibroblastic activation in fibrosis

Marie Bobowski-Gerard et al. Nat Commun. .

Abstract

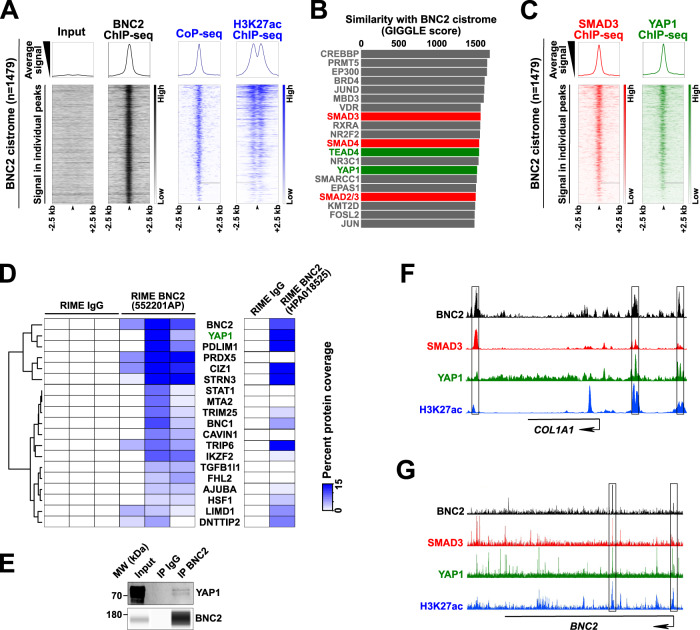
Tissue injury triggers activation of mesenchymal lineage cells into wound-repairing myofibroblasts, whose unrestrained activity leads to fibrosis. Although this process is largely controlled at the transcriptional level, whether the main transcription factors involved have all been identified has remained elusive. Here, we report multi-omics analyses unraveling Basonuclin 2 (BNC2) as a myofibroblast identity transcription factor. Using liver fibrosis as a model for in-depth investigations, we first show that BNC2 expression is induced in both mouse and human fibrotic livers from different etiologies and decreases upon human liver fibrosis regression. Importantly, we found that BNC2 transcriptional induction is a specific feature of myofibroblastic activation in fibrotic tissues. Mechanistically, BNC2 expression and activities allow to integrate pro-fibrotic stimuli, including TGFβ and Hippo/YAP1 signaling, towards induction of matrisome genes such as those encoding type I collagen. As a consequence, Bnc2 deficiency blunts collagen deposition in livers of mice fed a fibrogenic diet. Additionally, our work establishes BNC2 as potentially druggable since we identified the thalidomide derivative CC-885 as a BNC2 inhibitor. Altogether, we propose that BNC2 is a transcription factor involved in canonical pathways driving myofibroblastic activation in fibrosis.


Conflict of interest statement

The authors declare no competing interests.

Figures

Fig. 1
Fig. 1. Identification of MF identity genes through large-scale epigenomic and transcriptomic analyses.
A Breadth distribution of H3K4me3 domains called from ChIP-seq data from human primary MF-HSCs. The cumulative frequency distribution of H3K4me3 domain lengths is shown. The inflexion point of the curve was used to separate sharp from broad H3K4me3 domains. B Heatmap showing the relative length of H3K4me3 domains in 76 human cell types or tissues for 1278 genes linked to a broad H3K4me3 domain in primary MFs identified in (A). Hierarchical clustering was used to cluster both genes (rows) and samples (columns). Clusters were visualized on the heatmap using dotted lines. Three main gene clusters were identified and labeled clusters 1–3 (Supplementary Data File 1). At the top of the heatmap, the identity of cell types or tissues within the 5 main sample clusters are summarized (details are provided in Supplementary Data File 2). C 561 primary human cells were ranked based on increasing median expression levels of genes from cluster 1, 2, or 3. Next, the position of 64 MF cell types was indicated by purple horizontal bars within the ranking obtained using genes from cluster 1, cluster 2 or cluster 3. D Top 20 terms retrieved by Metascape when searching for pathways enriched within genes from clusters 1–3 (Hallmark Gene Sets, Reactome Gene Sets, KEGG Pathway, WikiPathways, Canonical Pathways, and PANTHER Pathways were used). Hierarchical clustering based on statistical significance is shown. White color indicates a lack of significance. Terms colored in red are preferentially enriched in cluster 1. E Proportion of matrisome genes in clusters 1–3. The percentage of matrisome genes in each cluster was retrieved by comparing genes from clusters 1–3 with a list of 1028 genes encoding ECM and ECM-associated proteins. Statistical significance was assessed using two-sided Fisher exact tests with Benjamini–Hochberg correction for multiple testing.
Fig. 2
Fig. 2. Identification of BNC2 as a MF identity TF.
A Network-based presentation of the 25 TFs identified by our approach. The connection between TFs was provided by String. TFs are colored according to the number of PubMed citations linking a given TF to MFs or fibrosis as detailed in the Methods section. TFs of the HOXB family were grouped together. TFs in the green background have no reported link to MFs or fibrosis. B Analysis performed as in (C) except cells were ranked according to increasing BNC2 expression levels. COL1A1 and ACTA2 expression levels are displayed using the same color scale. Ranking of 64 MF cell types is indicated at the bottom using purple horizontal bars. C Prediction of BNC2-associated functions by the Gene-module association Determination (G-MAD) tool. The top five terms (highest G-MAD scores) are shown.
Fig. 3
Fig. 3. Induction of Bnc2 expression characterizes MF-HSCs in mouse liver fibrosis.
A RT-qPCR data showing increased Bnc2 (n = 12 mice) and Col1a1 (n = 11 mice) expression in the fibrotic livers of mice injected with CCl4. Control mice were injected with olive oil (n = 4 mice). **P = 0.011. B RT-qPCR analysis of Bnc2 and Col1a1 expression in FACS-sorted cells obtained from the livers of mice injected with CCl4 (n = 6 mice) or olive oil (n = 7 mice). Hep. hepatocytes, KC Kupffer cells, HSC hepatic stellate cells, Chol. cholangiocytes, LSEC liver sinusoidal endothelial cells. *P = 0.0111. C RT-qPCR data showing increased Bnc2 and Col1a1 expression in the livers of mice fed the HFSC diet for 24 weeks (n = 11 mice) or a standard rodent chow diet (control, n = 10 mice). ***P < 0.0001. D RT-qPCR data showing increased Bnc2 and Col1a1 mRNA expression in the livers of mice fed the CDAA-HFSC diet for 10–12 weeks (n = 8 mice) or a standard rodent chow diet (control, n = 7 mice for Bnc2 and 6 for Col1a1). *P = 0.0289 and ***P = 0.0007. Graphs in panels AD show means ± SD. Statistical significance was assessed using two-tailed Mann–Whitney U test (A and C, D) or two-way ANOVA with Sidak multiple comparison post hoc test (B, CCl4 vs control). Source data are provided as a Source Data file.
Fig. 4
Fig. 4. Induction of BNC2 expression characterizes MF-HSCs in human liver fibrosis.
A RT-qPCR data showing increased BNC2 and COL1A1 expression in the livers of patients presenting alcohol-related cirrhosis (n = 42 biologically independent samples) versus control biopsies from the nontumoral areas of liver resections (n = 20 biologically independent samples). Box plots are composed of a box from the 25th to the 75th percentile with the median as a line and min to max as whiskers. Statistical significance was assessed using two-tailed Mann–Whitney U test. ***P < 0.0001. B Western blot assays showing BNC2, ACTA2 and type I Collagen (COL-I) protein expression in the livers of patients with alcohol-related cirrhosis (= 8 biologically independent samples) and control samples from the nontumoral areas of liver resections (= 6 biologically independent samples). Sub-cellular fractionation was performed for the detection of BNC2 (chromatin fraction) and ACTA2 (cytosolic fraction). H3 and GAPDH were used as loading controls. MW molecular weight markers. C Localization of BNC2 (white staining) and COL1A1 (red staining) mRNA in human alcohol-related cirrhotic livers. In situ RNA hybridation (RNAscope) was performed on paraffin-embedded liver sections obtained from patients presenting alcohol-related cirrhosis (n = 4 biologically independent samples) or control samples from the nontumoral areas of liver resections (n = 2 biologically independent samples). Dotted lines delimitate the hepatocyte and fibrous areas. C shows a representative image obtained from the liver of a patient with alcohol-related cirrhosis (Patient #A). Data obtained with livers from additional donors are shown in Supplementary Fig. 8A. D RNAscope analyses of BNC2 and COL1A1 mRNA expression in liver biopsies from patients with obesity-associated NASH showing bariatric surgery-induced loss of liver fibrosis (Kleiner Score F3 before surgery to F0/F1 1–5 years after surgery; n = 4 biologically independent sets of samples). D shows representative images obtained from the liver of one patient (Patient #G). Data obtained with livers from additional donors (n = 3) are shown in Supplementary Fig. 8C. The number of dots/cell at baseline and after surgery are shown in the right panel. Statistical significance was assessed two-tailed ratio paired t test. *P = 0.0416 or 0.0426 for BNC2 and COL1A1, respectively. Source data are provided as a Source Data file.
Fig. 5
Fig. 5. BNC2 cistrome and interactome point to functional intermingling with key fibrogenic signaling pathways.
A Input and BNC2 ChIP-seq signals together with CoP-seq and H3K27ac ChIP-seq signals from LX2 cells were visualized at the BNC2 cistrome (1479 binding sites). Heatmaps at the bottom show the signals in 5 kb regions centered on the BNC2 peaks. Average signals are plotted on top of the heatmaps. B The BNC2 cistrome was used to search for proteins with similar genomic binding profiles in CistromeDB and the top 20 hits were ranked according to the GIGGLE similarity score. Proteins involved in TGFβ signaling (SMADs) and Hippo/YAP1 (TEAD and YAP1) were highlighted in red and green, respectively. C Analyses performed as in A to monitor SMAD3 and YAP1 ChIP-seq signals from MFs at the BNC2 cistrome. D Transcriptional regulators specifically identified in BNC2 RIME but not IgG control RIME were clustered according to the percent protein coverage in individual biological replicates (n = 3 biologically independent experiments; anti-BNC2 antibody 55220-1-AP, Proteintech). Percent coverage obtained in an additional BNC2 RIME experiment using the anti-BNC2 antibody HPA018525 (Sigma-Aldrich) is shown on the right. E Nuclear extracts from LX2 cells expressing recombinant BNC2 and YAP1 were subjected to immunoprecipitation with an antibody against BNC2 (55220-1-AP, Proteintech). Immunoprecipitated material was analyzed by western blot using antibodies directed against BNC2 or YAP1. The presented data are representative of two biologically independent experiments. MW, molecular weight markers. F, G The Integrated Genome Browser (IGB) was used to visualize ChIP-seq profiles for BNC2 (black track, LX2 cells), SMAD3 (red track, LX2 cells), YAP1 (green track, IMR90 cells), and H3K27ac (blue track, MF-HSCs) at the COL1A1 (F) and BNC2 (G) genes.
Fig. 6
Fig. 6. BNC2 expression is induced by profibrogenic signaling pathways in MF-HSCs.
A RT-qPCR data showing changes in gene expression upon murine primary Q-HSCs spontaneous in vitro activation into MF-HSCs (n = 6 biologically independent experiments). Log2 fold changes (FC) between MF-HSCs (6 days of culture) and Q-HSCs (1 day of culture) are shown. B RT-qPCR data showing changes in gene expression upon YAP1 inhibition in MF-HSCs. Isolated mouse primary HSCs were treated with 1 µM verteporfin or vehicle for 6 days before being harvested [n = 3 (Yap1), 4 (Bnc2 and Ctgf), or 5 (Col1a1 and Acta2) biologically independent experiments]. Log2 FC between verteporfin and vehicle-treated cells are shown. C RT-qPCR data showing changes in gene expression upon Yap1 silencing in MF-HSCs (n = 3 biologically independent experiments). Log2 FC between siYAP1 and siCTRL-transfected cells are shown. D RT-qPCR data showing differences in gene expression in mouse primary HSCs grown for 9 days in 3D (spheroids) or in 2D [n = 3 (Bnc2) or 4 (Col1a1, Acta2, Yap1, Ctgf) biologically independent experiments). Log2 FC between cells grown in 3D and 2D are shown. BD Expression of Ctgf, an established YAP1 target, was assessed. E RT-qPCR data showing changes in gene expression induced by treatment of MF-HSCs with TGFβ (1 ng/mL) for 24 h (n = 4 biologically independent experiments). Log2 FC between cells treated with TGFβ and vehicle are shown. F RT-qPCR data showing changes in gene expression induced by treatment of EMS404 MF-HSCs with the indicated TGFβ signaling inhibitors for 24 h (n = 3 biologically independent experiments). Log2 FC between cells treated with TGFβ signaling inhibitors and vehicle are shown. In all panels, bar graphs show means ± SD. Statistical significance was assessed using two-sided one-sample t test with Benjamini–Hochberg correction for multiple testing to determine if the mean log2 FC was statistically different from 0. *P < 0.05, **P < 0.01, ***P < 0.001. Source data are provided as a Source Data file.
Fig. 7
Fig. 7. BNC2 controls the MF transcriptome, including fibrogenic ECM-related genes.
A Biological Process GO term enrichment analysis was performed using genes linked to the BNC2 cistrome. The main recovered terms are indicated under “BNC2 cistrome predicted targets”. Next, microarray-based analysis was used to define how BNC2 predicted target genes were deregulated upon BNC2 silencing. Dot plot depicts the results of GSEA performed for each term using transcriptomic changes induced by BNC2 silencing in LX2 cells, which were transfected with the BNC2-targeting siRNA (siBNC2) or a non-targeting control siRNA (siCTRL) (n = 4 biologically independent experiments). Dot areas are proportional to the normalized encrichment score (NES), while colors indicate the false discovery rate (FDR). A random list of 500 human genes was used as a negative control. B Genes both bound and regulated by BNC2, i.e., genes from the GSEA core enrichments from panel A, were further mined to search for enriched molecular pathways using ToppGene. Enriched terms were clustered according to the similarity of gene lists (Supplementary Fig. 12C), and main clusters pointing to related common molecular functions were further grouped. C, D Enrichment plots from GSEA performed using transcriptomic changes induced by siBNC2 in LX2 cells as the ranking measure and the Matrisome (ECM and ECM-associated genes, n = 1028; C) or human proteomics-based identified fibrotic liver ECM genes (n = 71; D) as the gene sets. NES and FDR are the normalized enrichment score and the false discovery rate provided by GSEA, respectively. E, F Enrichment plots from GSEA similar to those shown in (C, D) obtained using mining of transcriptomic data from EMS404 cells transfected using siBNC2 or siCTRL (control).
Fig. 8
Fig. 8. BNC2-mediated regulation of ECM-related gene expression in mouse and human MF-HSCs.
A, B RT-qPCR data showing changes in gene expression upon BNC2 silencing in human (A) and mouse (B) MF-HSC cell lines and primary cells. Cells were transfected with BNC2-targeting siRNA (siBNC2) or a non-targeting control siRNA (siCTRL) for 48 h. Data for LX2 are from biologically independent experiments [n = 4 (COL1A1, COL3A1, COL5A1, LOXL1) or 5 (BNC2, COL1A2, COL5A2, LAMA5, ITGA1)] while data for human primary MF-HSCs were obtained using cells from different donors (n = 3). Data for EMS404 are from biologically independent experiments (n = 3 or 2 for Col5a1) while data for mouse primary MF-HSCs were obtained using cells from independent isolations [n = 3 (Col5a1, Col5a2, Lama5, Itga1, Loxl1) or 4 (Bnc2, Col1a1, Col1a2, Col3a1)]. Log2 FC between siBNC2 and siCTRL-transfected cells are shown. C Simple western immunoassays used to monitor changes in BNC2 and type I collagen (COL-I) levels upon BNC2 silencing in LX2 (human) and EMS404 (mouse) cell lines. The lower panel shows the results of protein quantifications obtained from biologically independent experiments [(n = 3 (COL-I in EMS404), 4 (BNC2), or 5 (COL-I in LX2)]. BNC2 and COL-I levels were normalized to that of HSP90 or LMNA expression. Log2 FC between siBNC2 and siCTRL-transfected cells are shown. MW, molecular weight markers. D Simple Western immunoassays used to monitor changes in BNC2 levels in LX2 cells treated with 1 μM pomalidomide (Pom.), thalidomide (Thal.), CC-885, Iberdomide (Iber.) or vehicle for 24 h. Lower panel shows the results of protein quantification obtained from three biologically independent experiments. Data were normalized to LMNA protein expression, and Log2 FC between drug and vehicle-treated cells are shown. MW, molecular weight markers. E RT-qPCR data showing changes in gene expression upon treatment of LX2 cells as described for (D) (n = 3 biologically independent experiments or 2 for iberdomide). Log2 FC between drug and vehicle-treated cells are shown. Pom., pomalidomide; Thal.; thalidomide; Iber., iberdomide. In all panels, bar graphs show means ± SD. Statistical significance was assessed using two-sided one-sample t test with Benjamini–Hochberg correction for multiple testing to determine if the mean log2 FC was statistically different from 0. *P < 0.05, **P < 0.01, ***P < 0.001. Source data are provided as a Source Data file.
Fig. 9
Fig. 9. Bnc2 deficiency dampens induction of matrisome gene expression and collagen deposition by a mouse liver fibrogenic diet.
A Schematic summary of the experimental protocol. Heterozygous mice (+/−, n = 13 mice) and WT mice (+/+, n = 12 mice) were fed for 7.5 weeks with the CDAA-HFSC diet. Control WT mice were fed a chow diet (n = 6 mice). Blood and livers were collected the day of sacrifice for biochemistry, histological, and gene expression analyses shown in panels BH. A mouse was depicted using “Vector diagram of the laboratory mouse (black and white)“, https://commons.wikimedia.org/wiki/File:Vector_diagram_of_laboratory_mouse_(black_and_white).svg, available under the Creative Commons Attribution-Share Alike 4.0 International license (https://creativecommons.org/licenses/by-sa/4.0/deed.en). B Liver triglycerides (TG) content. C Aspartate aminotransferase (AST) plasma levels. D Quantification of collagen deposition was performed using Sirius red staining of two liver sections per mouse. Ten fields were randomly chosen within each section. The average percentage of fibrotic area is shown. The right panel shows representative images obtained for WT (+/+; n = 11 mice) or heterozygous (+/−; n = 12 mice) mice. E GSEA was used to define biological processes enriched for genes deregulated in the livers of Bnc2 heterozygous mice analyzed in (BD). Transcriptomic analyses were performed using livers from ten heterozygous (+/−) and ten WT (+/+) mice. Transcriptomic changes induced by Bnc2 deficiency were used as the ranking measure and biological processes (MiSigDB, v7.2) as the gene sets. Normalized enrichment scores (NES) for terms with FDR < 10−4 are shown. F, G Enrichment plots from GSEA performed using transcriptomic changes induced by Bnc2 deficiency in mice as the ranking measure and the Matrisome (ECM and ECM-related genes, n = 1028; F) or human fibrotic liver ECM genes (n = 71; G) as the gene sets. NES and FDR are the normalized enrichment score and the false discovery rate provided by GSEA, respectively. H RT-qPCR data showing the expression of matrisome genes in WT (+/+; n = 11 mice) and heterozygous (+/−; n = 13 mice) mice. BD, H Graphs show means ± SD. Statistical significance was assessed using one-way ANOVA with Tukey multiple comparison post hoc test (BD) or one-tailed Mann–Whitney U test with Benjamini–Hochberg correction for multiple testing (H). *P < 0.05, **P < 0.01, ***P < 0.001. Source data are provided as a Source Data file.
Fig. 10
Fig. 10. Summary of the main findings of this study.
Schematic depicting how BNC2 controls the establishment of the MF transcriptome and development of fibrosis.

References

    1. Rockey DC, Bell PD, Hill JA. Fibrosis—a common pathway to organ injury and failure. N. Engl. J. Med. 2015;372:1138–1149. doi: 10.1056/NEJMra1300575. - DOI - PubMed
    1. Henderson NC, Rieder F, Wynn TA. Fibrosis: from mechanisms to medicines. Nature. 2020;587:555–566. doi: 10.1038/s41586-020-2938-9. - DOI - PMC - PubMed
    1. Haas JT, Francque S, Staels B. Pathophysiology and mechanisms of nonalcoholic fatty liver disease. Annu. Rev. Physiol. 2016;78:181–205. doi: 10.1146/annurev-physiol-021115-105331. - DOI - PubMed
    1. Leslie M. The liver’s weighty problem. Science. 2015;349:18–20. doi: 10.1126/science.349.6243.18. - DOI - PubMed
    1. Distler JHW, et al. Shared and distinct mechanisms of fibrosis. Nat. Rev. Rheumatol. 2019;15:705–730. doi: 10.1038/s41584-019-0322-7. - DOI - PubMed

Publication types