. 2022 Oct:84:104244.
doi: 10.1016/j.ebiom.2022.104244. Epub 2022 Sep 9.

Loss-of-function variants in the KCNQ5 gene are implicated in genetic generalized epilepsies

Affiliations

Loss-of-function variants in the KCNQ5 gene are implicated in genetic generalized epilepsies

Johanna Krüger et al. EBioMedicine. 2022 Oct.

Abstract

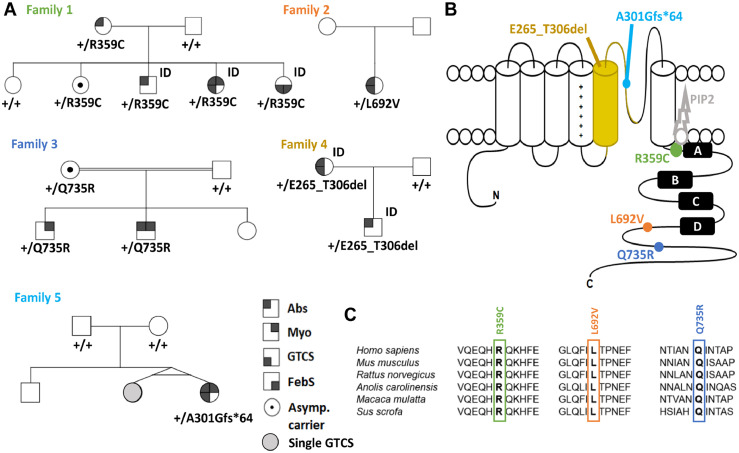
Background: De novo missense variants in KCNQ5, encoding the voltage-gated K+ channel KV7.5, have been described to cause developmental and epileptic encephalopathy (DEE) or intellectual disability (ID). We set out to identify disease-related KCNQ5 variants in genetic generalized epilepsy (GGE) and their underlying mechanisms.

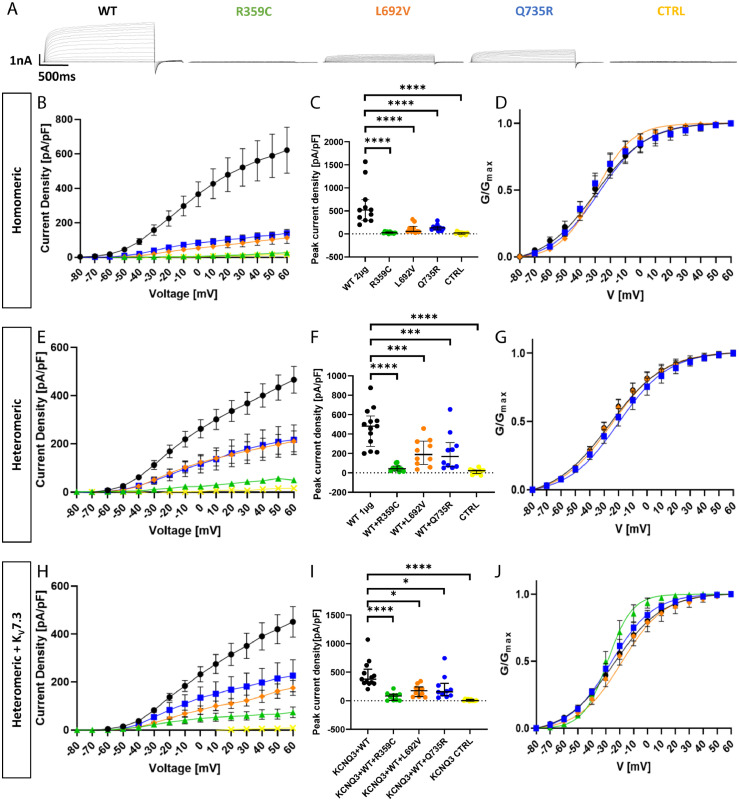
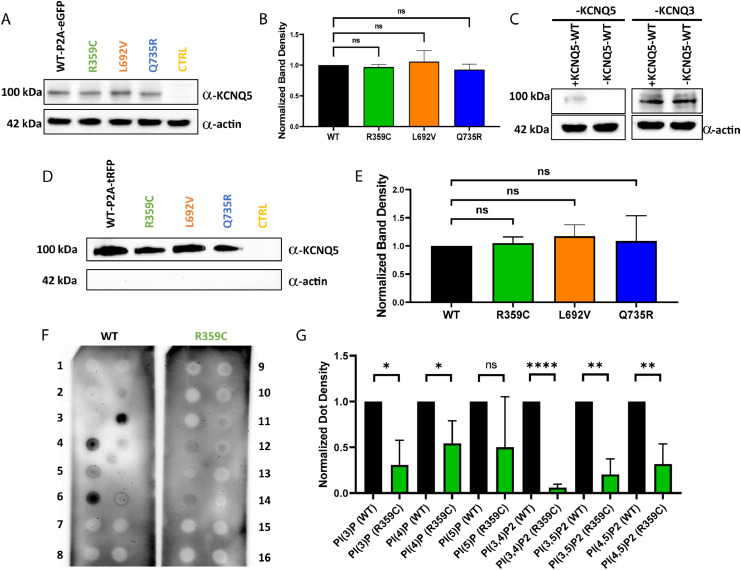
Methods: 1292 families with GGE were studied by next-generation sequencing. Whole-cell patch-clamp recordings, biotinylation and phospholipid overlay assays were performed in mammalian cells combined with homology modelling.

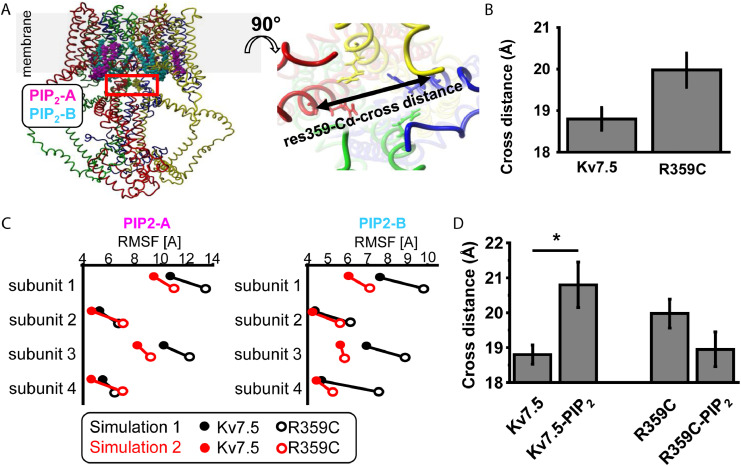
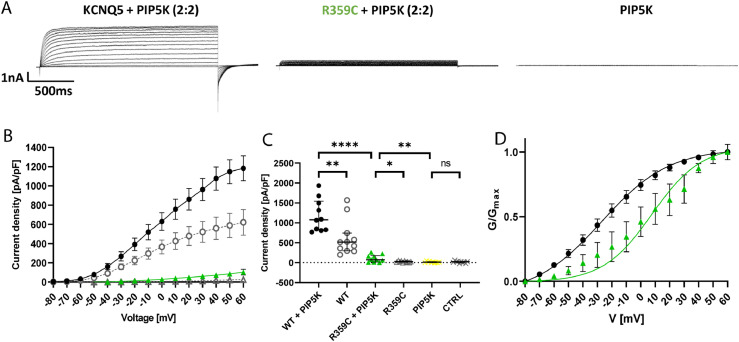
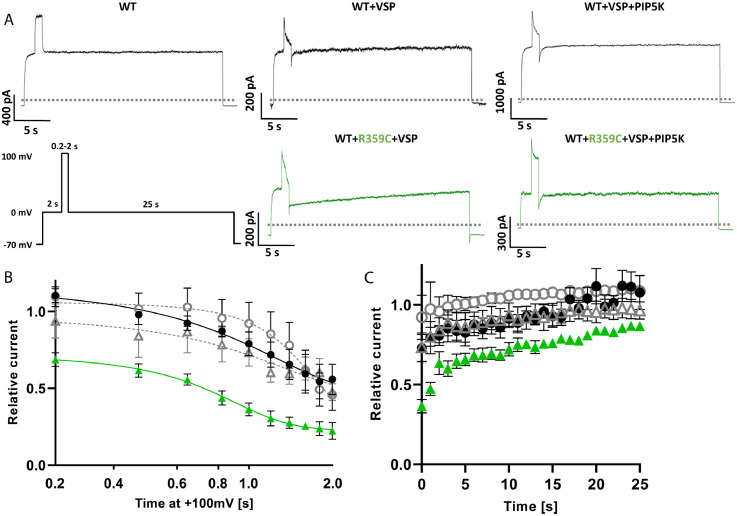
Findings: We identified three deleterious heterozygous missense variants, one truncation and one splice site alteration in five independent families with GGE with predominant absence seizures; two variants were also associated with mild to moderate ID. All missense variants displayed a strongly decreased current density indicating a loss-of-function (LOF). When mutant channels were co-expressed with wild-type (WT) KV7.5 or KV7.5 and KV7.3 channels, three variants also revealed a significant dominant-negative effect on WT channels. Other gating parameters were unchanged. Biotinylation assays indicated a normal surface expression of the variants. The R359C variant altered PI(4,5)P2-interaction.

Interpretation: Our study identified deleterious KCNQ5 variants in GGE, partially combined with mild to moderate ID. The disease mechanism is a LOF partially with dominant-negative effects through functional deficits. LOF of KV7.5 channels will reduce the M-current, likely resulting in increased excitability of KV7.5-expressing neurons. Further studies on network level are necessary to understand which circuits are affected and how this induces generalized seizures.

Funding: DFG/FNR Research Unit FOR-2715 (Germany/Luxemburg), BMBF rare disease network Treat-ION (Germany), foundation 'no epilep' (Germany).

Keywords: Exome sequencing; Genetic generalized epilepsy; KCNQ5; Loss-of-function; Patch-clamp.


Conflict of interest statement

Declaration of interests J. Krüger was financed by a grant from the Deutsche Forschungsgemeinschaft/German Research Foundation (DFG), during the conduct of the study; Dr. Schubert has nothing to disclose; Dr. Kegele has nothing to disclose; A. Labalme has nothing to disclose; Dr. Mao has nothing to disclose; J. Heighway has nothing to disclose; Dr. Seebohm has nothing to disclose; Dr. Yan has nothing to disclose; M. Koko reports grants from DAAD, outside the submitted work; Dr. Aslan has nothing to disclose; Dr. Caglayan has nothing to disclose; Dr. Steinhoff has nothing to disclose; Dr. Weber has nothing to disclose; Dr. Keo Kosal has nothing to disclose; Dr. Berkovic reports grants from NHMRC, during the conduct of the study; grants from UCB Pharma, grants from Eisai, grants from SciGen, personal fees from Bionomics, personal fees from Athena Diagnostics, outside the submitted work; In addition, Dr. Berkovic has a patent Methods of treatment, and diagnosis of epilepsy by detecting mutations in the SCN1A gene with royalties paid to Patent held by Bionomics Inc. Licensed to Athena Diagnostics; Genetics Technologies Ltd, a patent Diagnostic and Therapeutic Methods for EFMR (Epilepsy and Mental Retardation Limited to Females) with royalties paid to Licensed to Athena Diagnostics, and a patent A gene and mutations thereof associated with seizure and movement disorders (PRRT2) with royalties paid to Licensed to Athena Diagnostics; Dr. Hildebrand has nothing to disclose; Dr. Petrou reports personal fees and other from Praxis Precision Medicines, outside the submitted work; and Dr. Petrou works for a company, Praxis Precision Medicines that develop therapies for neurogenetic disorders such as KCNQ5 (but this is not currently under any consideration); Drs. Krause and May has report grants from the Fond Nationale de la Recherche in Luxembourg; Dr. Lesca has nothing to disclose; Dr. Maljevic has nothing to disclose; Dr. Lerche reports grants from the German Research Foundation (DFG), from the Federal Ministry for Education and Research (BMBF), grants from Foundation no epilep, during the conduct of the study; outside the submitted work, Dr. Lerche reports a grant from the Else-Kröner Fresenius Foundation (EKFS), a grant and personal fees from Bial, a grant from Boehringer Ingelheim, personal fees from Eisai, personal fees from UCB/Zogenix, personal fees from Arvelle/Angelini Pharma, personal fees from Desitin, and personal fees from IntraBio.

Figures

Figure 1
Figure 1
Variants affecting the Kv7.5 potassium channel. (A) Pedigrees of patients with individuals from Table 1 indicated by number. (B) Schematic of the Kv7.5 subunit of which four assemble to form a channel. Each subunit consists of a voltage-sensor domain (S1-S4) and a pore forming region (S5 and S6) including the pore loop. Point mutations are localized in highly conserved regions of the C-terminus (R359C, L692V, Q735R), while a splice site variant causes a deletion of the S5 segment and parts of the pore forming loop (E265_T306del) and a frame-shift mutation leads to an early stop codon in the pore loop (A301Gfs*64). (C) Amino acid alignment across multiple species (top) and across all human KV7 family members (bottom) shows evolutionary conservation of R359, L692, Q735 and their surrounding amino acids in KV7.5. Species from top to bottom: human, mouse, rat, Carolina anole, macaque, pig. ID = intellectual disability, Abs = absence seizure, Myo = myoclonic seizure, GTCS = generalized tonic clonic seizure, FebS = febrile seizure, asymp = asymptomatic.
Figure 2
Figure 2
Functional effects of Kv7.5 WT and mutant channels in Chinese hamster ovarian cells. (A) Representative K+ current traces from KCNQ5 WT (black), R359C (green), L692V (orange), Q735R (blue) and untransfected control cells (CTRL, yellow) during voltage steps from -80 mV to +60 mV in 10 mV increments. (B) Peak K+ currents of cells either transfected with WT or one mutated channel subunit were normalized by cell capacitances and plotted versus voltage. All variants result in a significant reduction in current density compared to the WT. WT, n = 11; R359C, n = 10; L692V, n = 10; Q735R, n = 10; CTRL, n = 10. (C) Comparison of maximum peak current density at +60 mV. All variants show a significant reduction compared to the WT. (D) Voltage-dependent activation curves. Lines represent Boltzmann functions fit to the normalized tail current. Currents in the R359C variant were too small to establish such a relationship. (E) Peak K+ currents normalized by cell capacitances and plotted versus voltage of cells either transfected with WT (1 µg) or WT and one mutated channel subunit (1 µg + 1 µg). The significant reduction persisted in all variants compared to the WT indicating a dominant negative effect of the variants on the WT. WT, n = 12; WT + R359C, n = 10; WT + L692V, n = 10; WT + Q735R, n = 10; CTRL, n = 10. (F) Comparison of maximum peak current density at +60 mV. All variants show a significant reduction compared to the WT. (G) Voltage-dependent activation curves. Lines represent Boltzmann functions fit to the normalized tail current. Currents of the WT + R359C were still too small to establish such a relationship. (H) Peak K+ currents normalized by cell capacitances and plotted versus voltage of cells either transfected with WT (1 µg) or WT and one mutated channel subunit (1 µg + 1 µg) in a CHO line stably transfected with KCNQ3-WT. The dominant negative effect of the variants on the WT and the significant reduction persisted in all variants compared to the WT. WT, n = 13; R359C, n = 10; L692V, n = 10; Q735R, n = 10; CTRL, n = 10. (I) Comparison of maximum peak current density at +60 mV. All variants show a significant reduction compared to the WT. (J) Voltage-dependent activation curves. Lines represent Boltzmann functions fit to the normalized tail current. Shown are means ± SEM (B, D, E, G, H, J). Scatter-and-whisker plots (C, F, I) show median (horizontal line) and the interquartile ranges. Dots indicate maximum values of single cells. *p ≤ 0·05; ** p ≤ 0·01; *** p ≤ 0·001; **** p ≤ 0·0001; Table 2 provides exact values and statistical analyses.
Figure 3
Figure 3
Functional effects of Kv7.5 WT and mutant channels in Chinese hamster ovarian cells (+ antibiotics cohort). (A) Representative K+ current traces from KCNQ5 WT (black) and c.901dupG (turquoise) during voltage steps from -80 mV to +60 mV in 10 mV increments. (B) Peak K+ currents of cells either transfected with WT or c.901dupG channel subunit were normalized by cell capacitances and plotted versus voltage. WT, n = 70; 901dupG, n = 16. (C) Comparison of maximum peak current density at +60 mV. c.901dupG results in a significant decrease in current density compared to the WT. (D) Peak K+ currents normalized by cell capacitances and plotted versus voltage of cells either transfected with WT (2·5 µg) or WT and 901dupG (2·5 µg + 2·5 µg). No significant differences were observed. WT, n = 40; WT+901dupG, n = 27. (E) Comparison of maximum peak current density at +60 mV. No significant differences were observed. (F) Voltage-dependent activation curves. Lines represent Boltzmann functions fit to the normalized tail current. Shown are means ± SEM (B, D, F). Scatter-and-whisker plots (C and E) show median (horizontal line) and the interquartile ranges. Dots indicate maximum values of single cells. **** p ≤ 0·001; ns non-significant; Table 2 provides exact values and statistical analyses.
Figure 4
Figure 4
Western blot analysis of KCNQ5 expression and phospholipid binding abilities in CHO cells. (A) Western blot of CHO cell lysates of transiently transfected cells (20µg per lane; n = 3). Controls consisted of untransfected CHO cells. (B) Comparison of KV7.5-WT expression to variants showed no significant changes (n = 3). (C) Western blot of KV7.3 and KV7.5 expression in the KV7.3 stable cell line (n = 4). (D) Biotinylation assays of transfected CHO cells for cell surface expression analysis (n = 3). (E) No significant changes in cell surface expression between KV7.5-WT and KV7.5 variants were observed (n = 3). Controls consisted of untransfected CHO cells. (F) Representative PIP strips of the phospholipid interaction of WT versus R359C (n = 3). 1 = Lysophosphatic acid, 2 = Lysophosphatidylcholine, 3 = Phosphatidylinositol, 4 = Phosphatidylinositol 3-phosphate, 5 = Phosphatidylinositol 4-phosphate, 6 = Phosphatidylinositol 5-phosphate, 7 = Phosphatidylethanolamine, 8 = Phosphatidylcholine, 9 = Sphingosine 1-phosphat, 10 = Phosphatidylinositol 3,4-bisphosphate, 11 = Phosphatidylinositol 3,5-bisphosphate, 12 = Phosphatidylinositol 4,5-bisphosphate, 13 = Phosphatidylinositol (3,4,5)-trisphosphate, 14 = Phosphatidic acid, 15 = Phosphatidylserine, 16 = blank. (G) Quantitative analysis of interactions on PIP strips (n = 3) using Student's unpaired t-test. ns non-significant; *p ≤ 0·05; ** p ≤ 0·01; *** p ≤ 0·001; **** p ≤ 0·0001.
Figure 5
Figure 5
Model predictions for KV7.5-WT and KV7.5-R359C and their interaction with PI(4,5)P2. (A) Two KV7.5 consensus homology models were generated and KV7.5-R359C was introduced in each model. PIP2 molecules were positioned in the KV7.5-WT and KV7.5-R359C models in the virtually identical position as described for the KV7.4-WT structure 7VNP.pdb.In silico, two PIP2 molecules bind to two distinct sites per KV7.5 subunit (PIP2-A is shown in magenta and PIP2-B is colored in cyan). The position of residues R359 are encircled by a red square (upper right), whereas each two R359 are positioned opposite in a tetrameric assembly and allow for calculation of two Cα cross distances in a membrane parallel plane (cartoon right). (B) Cα-cross distances in both 180° tilted directions were calculated resulting is two values per simulation. The cross distance of residue 359 tends to be slightly, however not significantly (Student's paired t-test), larger in KV7.5-R359C in absence of PIP2 in the simulations compared to the KV7.5-WT protein. (C) The more tight a PIP2 molecule binds the more restricted is its flexibility is which can be calculated as Root Mean Square Fluctuation (RMSF). The RMSF of PIP2 molecules -A and -B in the KV7.5-WT(filled symbols) and KV7.5 R359C (open symbols) channel complexes were calculated per channel subunit for both simulation approaches (simulation 1 in red and simulation 2 in black). In all simulations, both PIP2 binding sites for KV7.5-R359C mutant channels showed lower RMSF values compared to KV7.5-WT channels in silico (Paired Student's t-test, p= 0.0006). (D) The cross distance of KV7.5-R359 is significantly (Student's paired t-test) larger in presence of PIP2 (p=0.041) whereas this effect is not detected in the KV7.5-R359C.
Figure 6
Figure 6
Functional effects of PIP2 overexpression in KV7.5 WT vs. R359C channels in CHO cells. (A) Representative K+ current traces from KV7.5-WT + PIP5K (black), KV7.5-R359C + PIP5K (green), and PIP5K control cells (black) during voltage steps from -80 mV to +60 mV in 10 mV increments. (B) Peak K+ currents of cells either transfected with WT alone (grey dots), WT + PIP5K (black), R359C (grey triangles) or R359C + PIP5K (green triangle) channel subunit were normalized by cell capacitances and plotted versus voltage. The currents generated by KV7.5-R359C + PIP5K remain largely reduced as compared to KV7.5-WT + PIP5K. KV7.5-WT, n = 12; KV7.5-WT + PIP5K, n = 10; KV7.5-R359C, n = 10; KV7.5-R359C + PIP5K, n = 10; PIP5K, n = 10; CTRL n = 10. (C) Comparison of maximum peak current density at +60 mV. PIP5K co-expression significantly increased the KV7.5-R359C peak current density, yet it is still significantly reduced as compared to KV7.5-WT + PIP5K. (D) Voltage-dependent activation curves. Lines represent Boltzmann functions fit to the normalized tail current. The activation curve for KV7.5-R359C + PIP5K is significantly shifted towards more positive voltages. Shown are means ± SEM (B, D). Scatter-and-whisker plots (C) show median (horizontal line) and the interquartile ranges. Dots indicate maximum values of single cells. **** p ≤ 0·001; **p ≤ 0·01; * p ≤ 0·05; ns non-significant; Table 3 provides exact values and statistical analyses.
Figure 7
Figure 7
Functional effects of PIP2 depletion in KV7.5-WT vs. KV7.5-R359C channels in CHO cells. (A) Representative K+ current traces from WT (control), KV7.5-WT + VSP, KV7.5-WT + VSP + PIP5K (all black), KV7.5-WT + R359C + VSP, and KV7.5-WT + R359C + VSP + PIP5K (both green) cells responding to the displayed voltage protocol. The dotted line indicates 0 pA. (B) Time dependence of current decrease under VSP activation in the absence (WT black dots, R359C green triangles; n = 5 for both) or presence of PIP5K (WT grey dots, R359C grey triangles; n = 5). These values were calculated by normalizing the values immediately after the +100 mV step to those immediately prior to it and a Boltzmann function was fit to the data points. (C) Time dependence of current recovery after VSP activation in the absence (WT black dots, R359C green triangles; n = 5 for both) or presence of PIP5K (WT grey dots, R359C grey triangles; n = 5). These values were calculated by normalizing the values every second after the +100 mV step to that immediately prior to it. Shown are means ± SEM (B, C).

References

    1. Lerche C, Scherer CR, Seebohm G, et al. Molecular cloning and functional expression of KCNQ5, a potassium channel subunit that may contribute to neuronal M-current diversity. J Biol Chem. 2000;275(29):22395–22400. - PubMed
    1. Schroeder BC, Hechenberger M, Weinreich F, Kubisch C, Jentsch TJ. KCNQ5, a novel potassium channel broadly expressed in brain, mediates M-type currents. J Biol Chem. 2000;275(31):24089–24095. - PubMed
    1. Wang H. KCNQ2 and KCNQ3 potassium channel subunits: Molecular correlates of the M-channel. Science. 1998;282(5395):1890–1893. - PubMed
    1. Wang Q, Curran ME, Splawski I, et al. Positional cloning of a novel potassium channel gene: KVLQT1 mutations cause cardiac arrhythmias. Nat Genet. 1996;12(1):17–23. - PubMed
    1. Biervert C, Schroeder BC, Kubisch C, et al. A potassium channel mutation in neonatal human epilepsy. Science. 1998;279(5349):403–406. - PubMed