. 2022 Oct:56:102460.
doi: 10.1016/j.redox.2022.102460. Epub 2022 Sep 3.

Capsaicin ameliorates diabetic retinopathy by inhibiting poldip2-induced oxidative stress

Affiliations

Capsaicin ameliorates diabetic retinopathy by inhibiting poldip2-induced oxidative stress

Kou Liu et al. Redox Biol. 2022 Oct.

Abstract

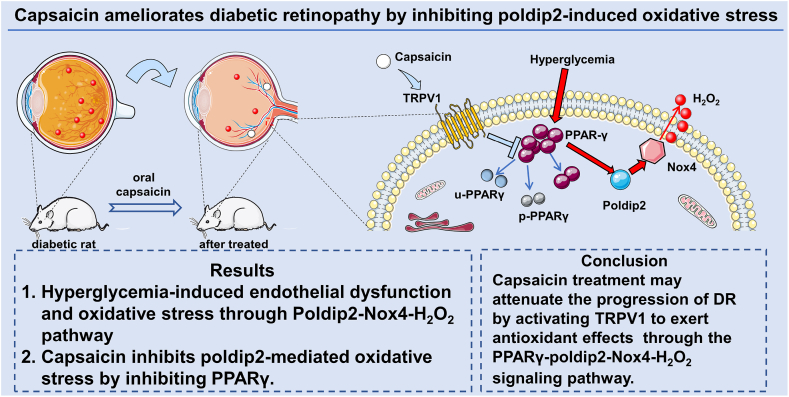
Background: Oxidative stress and the resultant hyperpermeability play a vital role in the pathogenesis of diabetic retinopathy (DR). Poldip2 has been implicated in H2O2 production, but the effects of capsaicin on poldip2 have not been reported.

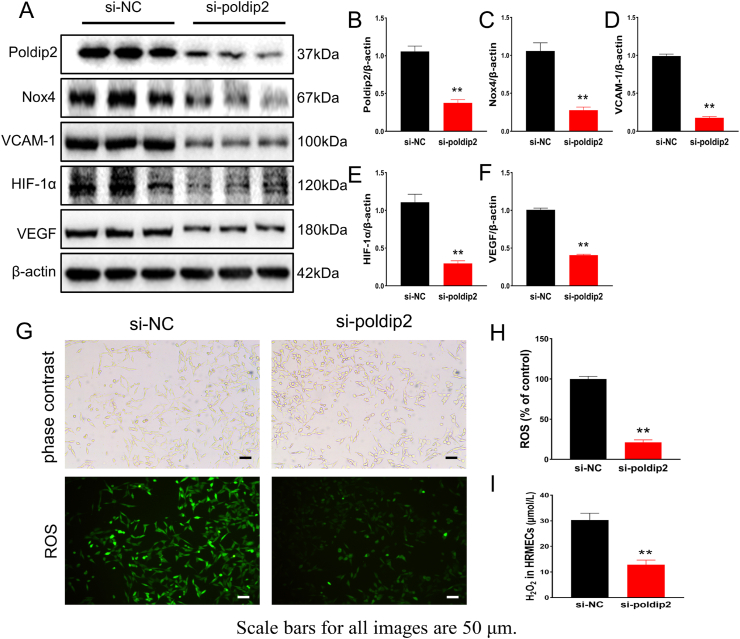
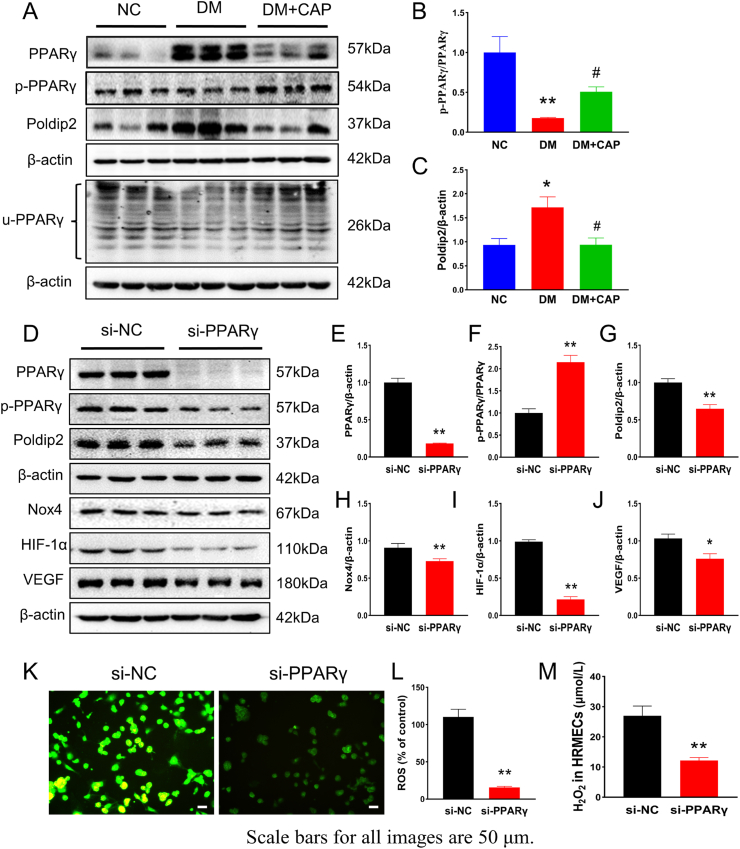
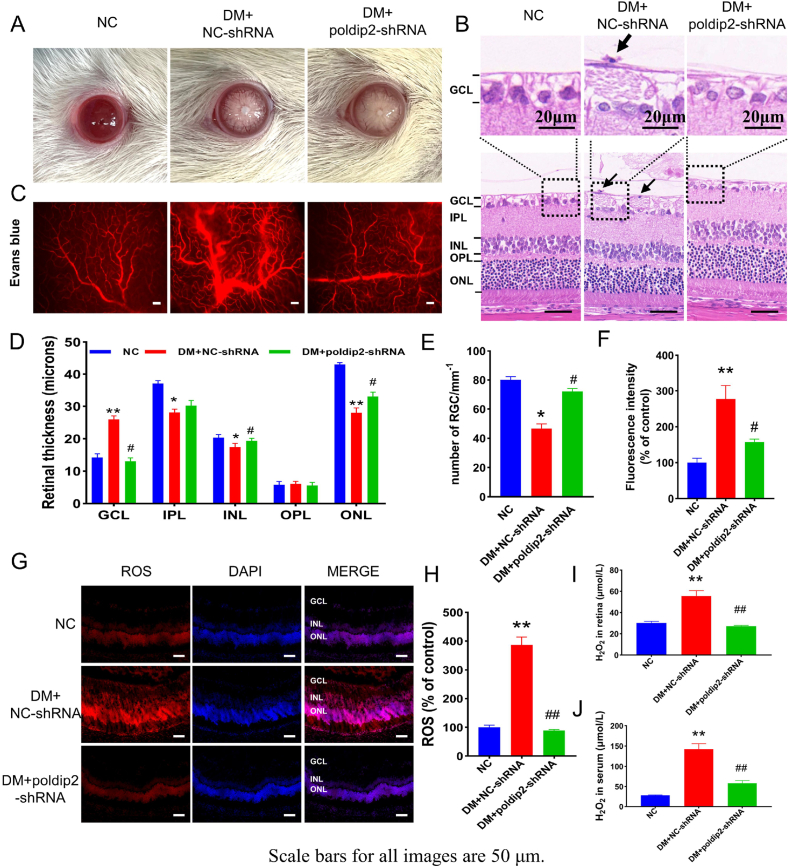
Methods: Diabetic Sprague-Dawley (SD) rats induced with STZ were treated with capsaicin or AAV9-poldip2-shRNA, and human retinal microvascular endothelial cells (HRMECs) were treated with capsaicin or poldip2 siRNA.

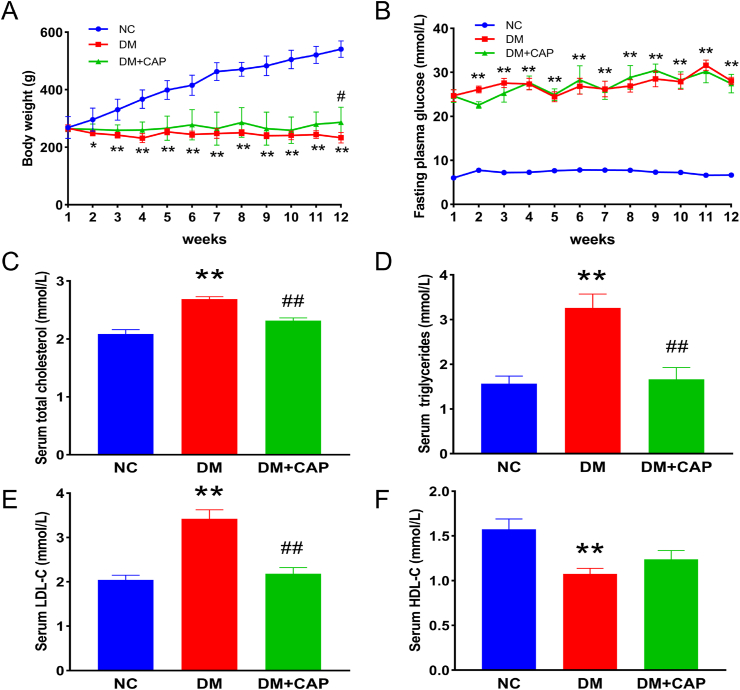
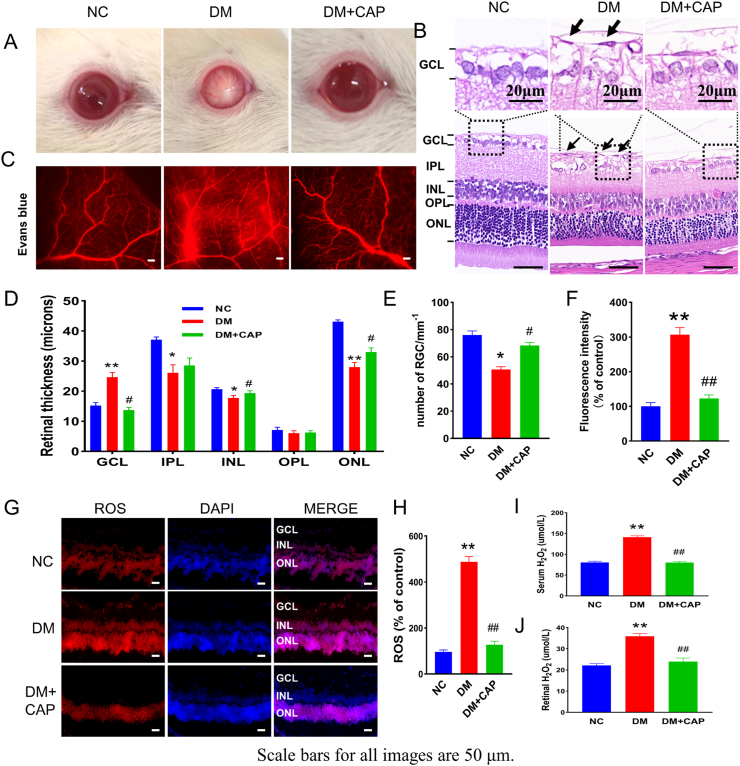
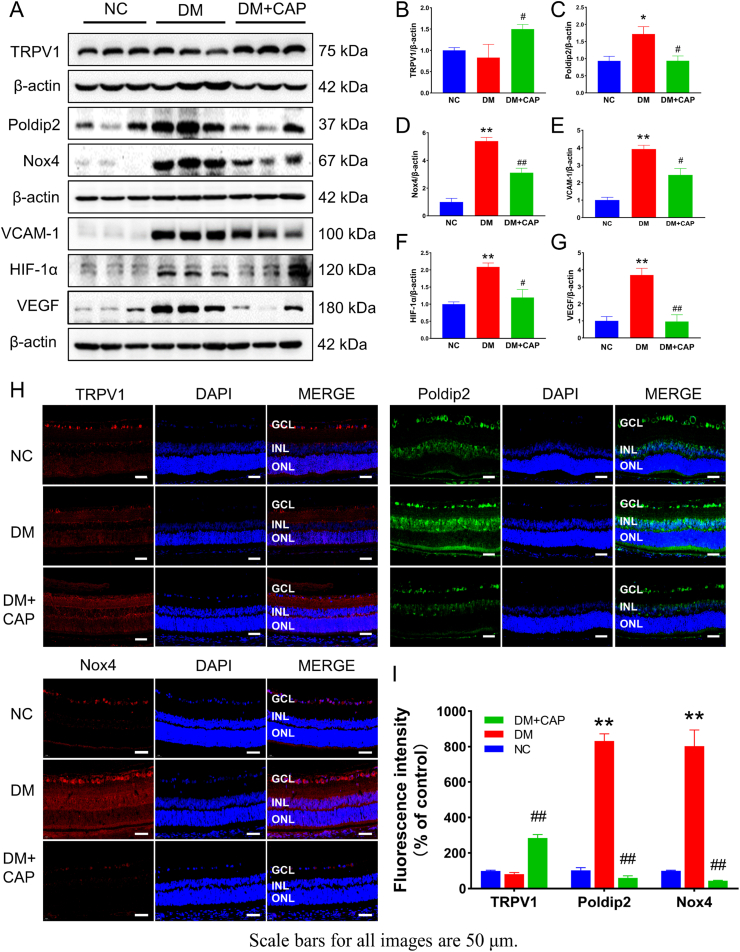
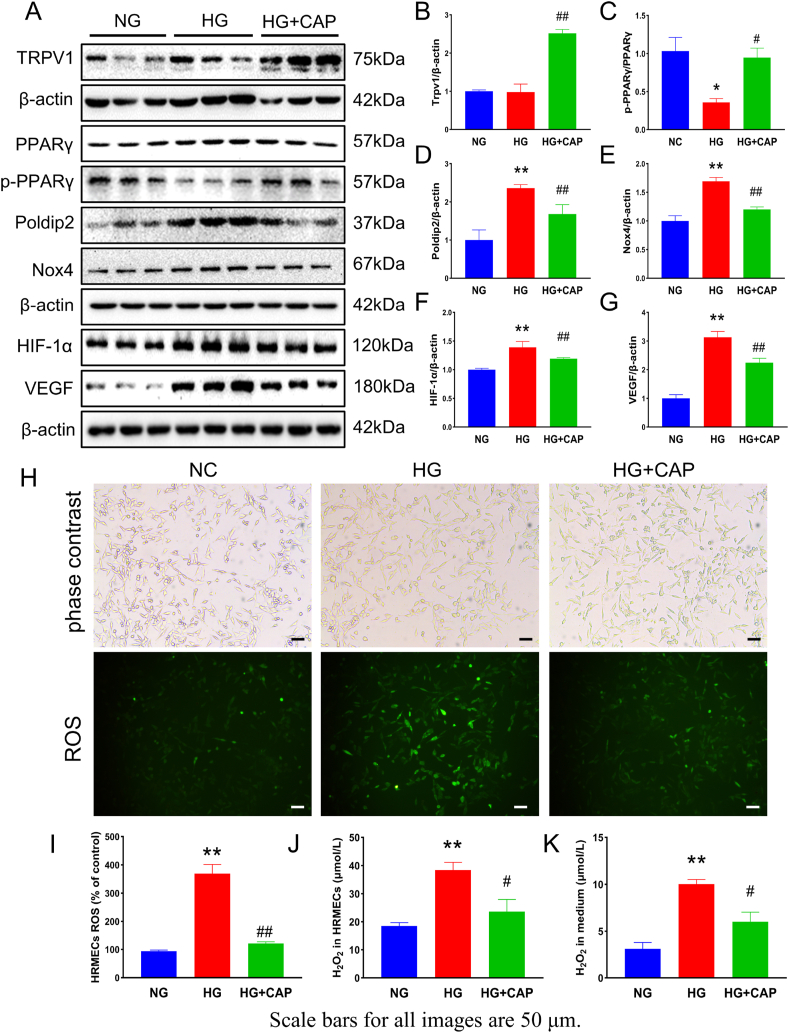
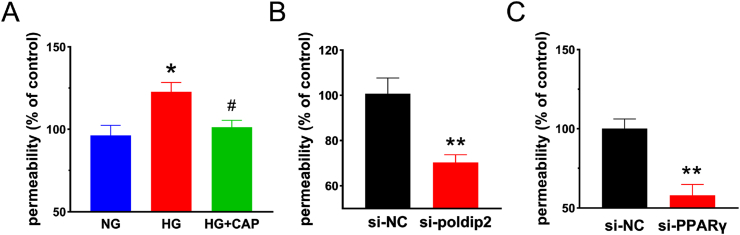
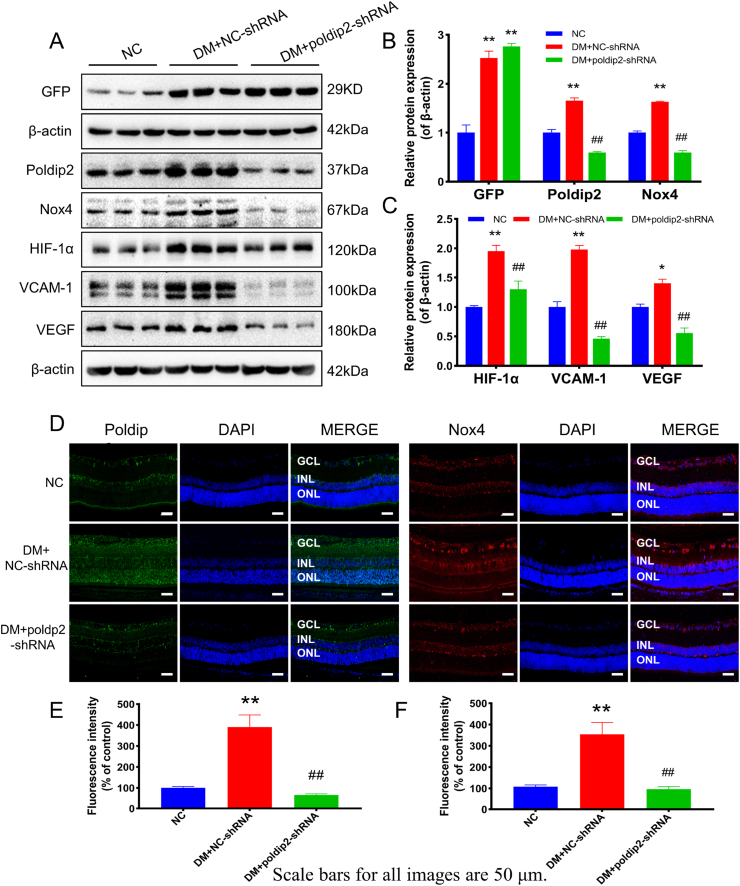
Results: Current data indicated that the expression of PPARγ, poldip2, Nox4, VCAM-1, HIF-1α, and VEGF increased in rat retinas with DR and in HRMECs treated with high glucose. The production of ROS or H2O2 in the tissues, serum, and cells increased, and the paracellular permeability of cultured HRMECs with high glucose significantly increased. In addition, overt hyperpermeability of retinal microvessels and increased retinal neovascularization in diabetic rats were observed. However, capsaicin treatment inhibited these increases and suppressed the expression of PPARγ by enhancing its phosphorylation and ubiquitination in the retinas of DR rats. Poldip2 knockdown in HRMECs or its silencing in the retina of DR rats concomitantly led to reduced levels of Nox4, VCAM-1, HIF-1α, VEGF, ROS, and H2O2, and the paracellular permeability of HRMECs or the hyperpermeability of retinal microvessels in diabetic rat retinas decreased. Similarly, after PPARγ knockdown in HRMECs, poldip2, Nox4, HIF-1α, VEGF, ROS, and H2O2 decreased, and the monolayer paracellular permeability was reduced accordingly.

Conclusion: Capsaicin may ameliorate diabetic retinopathy by activating TRPV1 and suppressing the PPARγ-poldip2-Nox4 pathway.

Keywords: Capsaicin; Diabetic retinopathy; Nox4; Oxidative stress; Poldip2.


Conflict of interest statement

Declaration of competing interest The authors declare that they have no conflict of interest.

Figures

Fig. 1
Fig. 1
Effects of capsaicin treatment on body weights, serum glucose and lipid in rats. (A) Body weights of rats in different groups. (B) Fasting plasma glucose of rats in different groups. (C) Serum total cholesterol in rats in different groups. (D) Serum triglyceride in rats in different groups. (E) Serum low-density lipoprotein in rats in different groups. (F) Serum high-density lipoprotein in rats in different groups. One-way ANOVA, data are the means ± SEM from 5 to 8 rats/group (A, B) and 8 rats/group (C, D, E, F). Compared with NC group: *p < 0.05, **p < 0.01; Compared with DM group: #p < 0.05, ##p < 0.01. NC: normal control group. DM: diabetic group. DM + CAP: diabetic with capsaicin treatment group.
Fig. 2
Fig. 2
Capsaicin alleviates the pathological changes of DR and reduces ROS in vivo. (A) Photographs of the ocular surface of rats in different groups. (B) Photographs of HE staining of rats in different groups. (C) Photographs of Evans blue angiography of rat retina in different groups. (D) Analysis of the thickness of the subretinal layers. (E) The number of retinal ganglion cells. (F) Analysis of the fluorescence intensity. (G–H) The levels of ROS in rat retina in different groups. (I–J) The levels of H2O2 in different groups. One-way ANOVA, data represents mean ± SEM, n = 3–5/group, Scale bar: 50 μm. Compared with NC group: *p < 0.05, **p < 0.01; Compared with DM group: #p < 0.05, ##p < 0.01. NC: normal control group. DM: diabetic group. DM + CAP: diabetic with capsaicin treatment group. (For interpretation of the references to colour in this figure legend, the reader is referred to the Web version of this article.)
Fig. 3
Fig. 3
Capsaicin regulates proteins associated with oxidative stress and endothelial dysfunction in vivo. (A–G) Shown is the expression of TRPV1, poldip2, Nox4, VCAM-1, HIF-1α, and VEGF in rat retina in different groups. (H–I) The expression of TRPV1, poldip2, and Nox4 in rat retina by immunofluorescence in different groups. One-way ANOVA data represents mean ± SEM, n = 3–5/group, Scale bar: 50 μm. Compared with NC group: *p < 0.05, **p < 0.01; Compared with DM group: #p < 0.05, ##p < 0.01. NC: normal control group. DM: diabetic group. DM + CAP: diabetic with capsaicin treatment group.
Fig. 4
Fig. 4
Capsaicin reduces high glucose concentration induced endothelial cell dysfunction and oxidative stress in vitro. (A–G) Displayed is the expression of TRPV1, PPARγ, p-PPARγ, poldip2, Nox4, VCAM-1, HIF-1α and VEGF in cultured HRMECs by different treatments. (H–I) The levels of ROS in HRMECs by different treatments. (J–K) The levels of H2O2 in HRMECs by different treatments. One-way ANOVA, data represents mean ± SEM, n = 3–5/group. Compared with NG group: *p < 0.05, **p < 0.01; compared with HG group: #p < 0.05, ##p < 0.01. NG: normal glucose group, HG: high glucose group, HG + CAP: high glucose with capsaicin treatment group.
Fig. 5
Fig. 5
In vitro knockdown of poldip2 inhibited oxidative stress. (A–F) The expression of poldip2, Nox4, VCAM-1, HIF-1α and VEGF in HRMECs is demonstrated in different treatments. (G–I) Levels of ROS and H2O2 in HRMECs in different siRNA treatments. Student's t-test. Results are from three independent replicate experiments, data represents mean ± SEM, n = 3/group, scale bar: 50 μm. Compared with si-NC group: **p < 0.01. si-NC: control group, si-poldip2: poldip2 siRNA transfection group.
Fig. 6
Fig. 6
Capsaicin inhibits poldip2-mediated oxidative stress by inhibiting PPARγ. (A–C) The levels of PPARγ, p-PPARγ, u-PPARγ and poldip2 in rat retina are shown in different groups. One-way ANOVA. (D–J) Displayed is the expression of poldip2, Nox4, VCAM-1, HIF-1α and VEGF in cultured HRMECs treated by NC-siRNA and PPARγ siRNA, respectively. Student's t-test. (K–M) Levels of ROS and H2O2 in cultured HRMECs treated by NC-siRNA and PPARγ siRNA, respectively. Student's t-test. Data represents mean ± SEM, n = 3/group, scale bar: 50 μm. Compared with NG group: *p < 0.05, **p < 0.01; compared with HG group: #p < 0.05. Compared with si-NC group: *p < 0.05. **p < 0.01. NG: normal glucose group, HG: high glucose group, HG + CAP: high glucose with capsaicin treatment group. si-NC: control group, si- PPARγ: PPARγ siRNA transfection group.
Fig. 7
Fig. 7
Paracellular permeability in vitro was detected by Transwell. (A) Exhibited is the cultured paracellular permeability in different groups with/without high glucose media. One-way ANOVA. (B) Paracellular permeability in different groups with/without silencing PPARγ in HRMECs. Student's t-test. (C) Displayed is the paracellular permeability in different groups with/without silencing poldip2 in HRMECs. Student's t-test. Data represents mean ± SEM, n = 4/group. Compared to NG group: *p < 0.05; Compared with HG group: #p < 0.05. Compared with si-NC group: **p < 0.01. NG: normal glucose group, HG: high glucose group, HG + CAP: high glucose with capsaicin treatment group. si-NC: control group, si-poldip2: poldip2 siRNA transfection group, si-PPARγ: PPARγ siRNA transfection group.
Fig. 8
Fig. 8
Knockdown of poldip2 in vivo improves the pathological changes of DR and reduces ROS. (A) Photographs of the ocular surface of rats in different groups. (B) Photographs of the HE staining of rat subretinal tissues in different groups. (C) Photographs of Evans blue angiography of rat retina in different groups with/without poldip2-shRNA treatment. (D) Analysis of the thickness of the rat subretinal layers. (E) The number of retinal ganglion cells. (F) Analysis of the fluorescence intensity. (G–H) The levels of ROS in rat retina in different groups with/without poldip2-shRNA treatment. (I–J) The levels of H2O2 in rat retina in different groups with/without poldip2-shRNA treatment. One-way ANOVA. Data are the means ± SEM, n = 3–4/group, scale bar: 50 μm. Compared with NC group: **p < 0.01; Compared with DM + NC-shRNA group: #p < 0.05, ##p < 0.01. NC: normal control group. DM + NC-shRNA group: diabetic group treated with scrambled-AAV9-shRNA. DM + poldip2-shRNA: diabetic treated with AAV9-poldip2-shRNA. (For interpretation of the references to colour in this figure legend, the reader is referred to the Web version of this article.)
Fig. 9
Fig. 9
Knockdown of poldip2 in vivo regulates proteins associated with oxidative stress and endothelial dysfunction. (A–C) The expression of GFP, poldip2, Nox4, VCAM-1, HIF-1α and VEGF in rat retina is shown in different groups with/without poldip2-shRNA treatment. (D–F) The expression of poldip2 and Nox4 in rat retina detected by immunofluorescence in different groups with/without poldip2-shRNA treatment. One-way ANOVA. Data are the means ± SEM from 5/group (A) and 3/group (D). Compared with NC group: *p < 0.01, **p < 0.01; Compared with DM + NC-shRNA group: ##p < 0.01. NC: normal control group. DM + NC-shRNA group: diabetic group treated with scrambled-AAV9-shRNA. DM + poldip2-shRNA: diabetic treated with AAV9-poldip2-shRNA.
Fig. 10
Fig. 10
Schematic diagram of this study. Hyperglycemia-induced endothelial dysfunction and oxidative stress through poldip2-Nox4-H2O2 pathway, while capsaicin may ameliorate diabetic retinopathy by activation of TRPV1 and then suppression of PPARγ-poldip2-Nox4 pathway.

References

    1. Wong T.Y., Cheung C.M.G., Larsen M., Sharma S., Simó R. Diabetic retinopathy. Nat. Rev. Dis. Prim. 2016;2 doi: 10.1038/nrdp.2016.12. - DOI - PubMed
    1. Mahajan N., Arora P., Sandhir R. Perturbed biochemical pathways and associated oxidative stress lead to vascular dysfunctions in diabetic retinopathy. Oxid. Med. Cell. Longev. 2019 doi: 10.1155/2019/8458472. 2019. - DOI - PMC - PubMed
    1. Kang Q., Yang C. Oxidative stress and diabetic retinopathy: molecular mechanisms, pathogenetic role and therapeutic implications. Redox Biol. 2020;37 doi: 10.1016/j.redox.2020.101799. - DOI - PMC - PubMed
    1. D'Amico A.G., Maugeri G., Rasà D.M., La Cognata V., Saccone S., Federico C., Cavallaro S., D'Agata V. Modulation of IL-1β and VEGF expression in rat diabetic retinopathy after PACAP administration. Peptides. 2017;97:64–69. doi: 10.1016/j.peptides.2017.09.014. - DOI - PubMed
    1. D'Amico A.G., Maugeri G., Rasà D.M., La Cognata V., Saccone S., Federico C., Cavallaro S., D'Agata V. Nap interferes with hypoxia-inducible factors and VEGF expression in retina of diabetic rats. J. Mol. Neurosci. 2017;61(2):256–266. doi: 10.1007/s12031-016-0869-6. - DOI - PubMed

Publication types

MeSH terms