. 2022 Nov;21(11):100410.
doi: 10.1016/j.mcpro.2022.100410. Epub 2022 Sep 9.

Ionizing Radiation Drives Key Regulators of Antigen Presentation and a Global Expansion of the Immunopeptidome

Affiliations

Ionizing Radiation Drives Key Regulators of Antigen Presentation and a Global Expansion of the Immunopeptidome

Arun Tailor et al. Mol Cell Proteomics. 2022 Nov.

Abstract

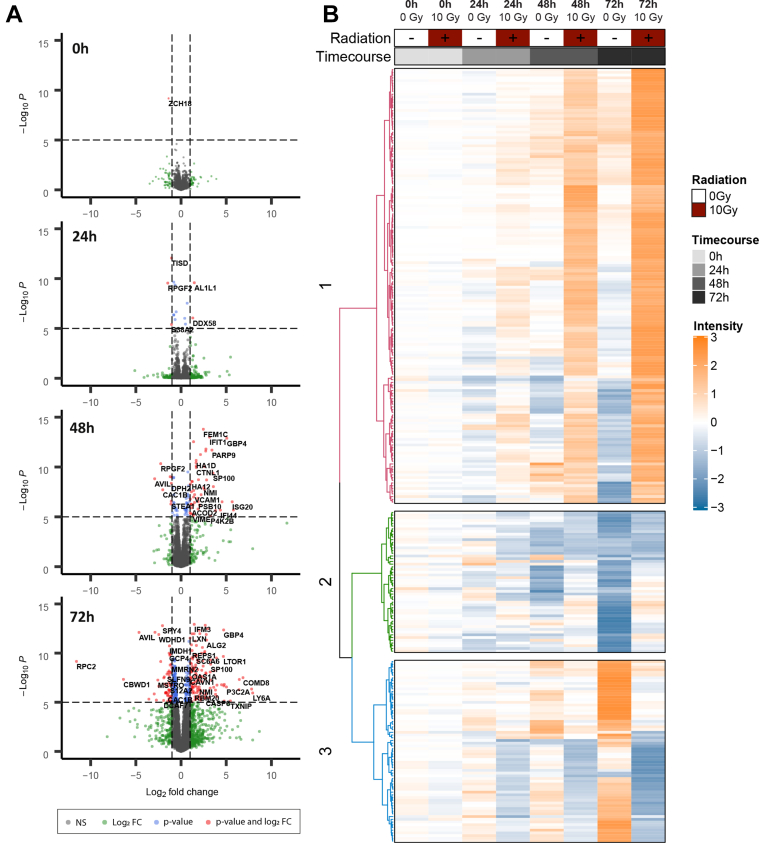
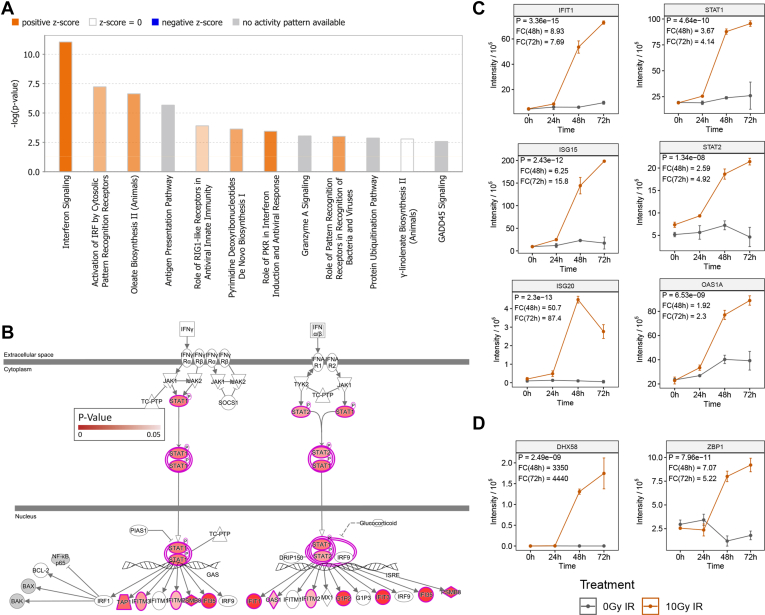
Little is known about the pathways regulating MHC antigen presentation and the identity of treatment-specific T cell antigens induced by ionizing radiation. For this reason, we investigated the radiation-specific changes in the colorectal tumor cell proteome. We found an increase in DDX58 and ZBP1 protein expression, two nucleic acid sensing molecules likely involved in induction of the dominant interferon response signature observed after genotoxic insult. We further observed treatment-induced changes in key regulators and effector proteins of the antigen processing and presentation machinery. Differential regulation of MHC allele expression was further driving the presentation of a significantly broader MHC-associated peptidome postirradiation, defining a radiation-specific peptide repertoire. Interestingly, treatment-induced peptides originated predominantly from proteins involved in catecholamine synthesis and metabolic pathways. A nuanced relationship between protein expression and antigen presentation was observed where radiation-induced changes in proteins do not correlate with increased presentation of associated peptides. Finally, we detected an increase in the presentation of a tumor-specific neoantigen derived from Mtch1. This study provides new insights into how radiation enhances antigen processing and presentation that could be suitable for the development of combinatorial therapies. Data are available via ProteomeXchange with identifier PXD032003.


Conflict of interest statement

Conflict of interest The authors declare that they have no conflicts of interest with the contents of this article.

Figures

None
Graphical abstract
Fig 1
Fig 1
Differential expression of CT26 proteome at 0 h, 24 h, 48 h, and 72 h post single dose 10 Gy irradiation.A, volcano plots of differentially expressed proteins (red) isolated by time point (limma, -Log10p /> 5, -Log2 fold change >1.5). B, heatmap depicting deregulated proteins with two-way-ANOVA interaction p value less than 0.0001 (279 proteins). CT, cancer testis.
Fig 2
Fig 2
Overall pathway analysis and interferon signaling in the CT26 proteome upon irradiation.A, Ingenuity Pathway Analysis of differentially expressed proteins at 48 h post 10 Gy irradiation (-Log2 fold change >1.5). B, Interferon Signaling Ingenuity Pathway visualized with p-values for quantifiable proteins in the CT26 proteome. C, normalized intensity plots of proteins encompassing the Interferon Signaling Pathway. D, the Activation of IRF pathway in the CT26 proteome upon irradiation. Points are representative of mean ± SD values of three biological replicates and p-values are representative of two-way ANOVA, where gray indicates untreated, and orange indicates 10 Gy treated. CT, cancer testis.
Fig 3
Fig 3
Analysis of the antigen presentation pathway in the CT26 proteome upon irradiation.A, Antigen Presentation Ingenuity Pathway visualized with p-values for quantifiable proteins in the CT26 proteome. B, intensity plots of proteins encompassing the antigen presentation & ubiquitylation pathways in the CT26 proteome upon irradiation. Points are representative of mean ± SD values of three biological replicates and p-values are representative of two-way ANOVA, where gray indicates untreated, and orange indicates 10 Gy IR treated. C, flow cytometric validation of mouse MHC class I expression on the CT26 cell surface upon irradiation. D, Western blot validation of mouse immunoproteasome subunits upon irradiation. p-values are representative of a paired student’s t test and have been denoted by ∗ <0.05. CT, cancer testis.
Fig 4
Fig 4
Analysis of CT26 immunopeptidome upon irradiation.A, total MHC peptide intensity at 0 Gy and 10 Gy at 24 and 48 h postirradiation. B, length intensity distribution of MHC peptides at 0 Gy and 10 Gy at 24 and 48 h postirradiation. C, Seqlogo comparison of MHC-binding motifs before and after irradiation for combined 24 and 48 h time points. Peptides were assessed using NetMHCPan 4.1. D, allele-binding intensity distribution at 0 Gy and 10 Gy at 24 and 48 h postirradiation. E, unique MHC peptides at 0 Gy and 10 Gy at 24 and 48 h postirradiation. p-values are representative of a paired student’s t test and have been denoted by ∗ <0.05, ∗∗ <0.01 and ns for not significant. CT, cancer testis.
Fig 5
Fig 5
Cross analysis of CT26 proteome and immunopeptidome and radiation-induced antigens.A, correlation plot of the proteome protein and the immunopeptidome peptide ratio at 48 h post 10 Gy. Significantly differentially expressed proteins and peptides are indicated by their colors. A bar chart to quantify proteins in each quadrant is detailed to show an alternative representation of the data. B, centered heatmap of changes in the immunopeptidome in significantly upregulated (left) and downregulated (right) proteins in the proteome. C, coverage of MHC peptide source proteins in the proteome (top). Coverage of proteome among source proteins in the immunopeptidome (middle). Overlap of proteome and immunopeptidome source proteins (bottom). CT, cancer testis.
Fig 6
Fig 6
Mass spectrometric validation of the KYLSVQSQL neoantigen.A, location of KYLSVQGQL and the G > S mutation in the MTCH1_MOUSE protein sequence. B, PRM-based absolute quantification of KYLSVQGQL and KYLSVQSQL peptides in the CT26 immunopeptidome at 24 and 48 h post 10 Gy irradiation. C, spectral mirroring of KYLSVQGQL (left) and KYLSVQSQL (right) of endogenous peptide found in the CT26 immunopeptidome at 48 h postirradiation against the synthetic spectrum. The b8 ion has been highlighted as the distinguishing ion between the unmutated and mutated peptide. p-values are representative of a paired student’s t test and have been denoted by ∗ <0.05 and ns for not significant. CT, cancer testis.

References

    1. Lee Y., Auh S.L., Wang Y., Burnette B., Wang Y., Meng Y., et al. Therapeutic effects of ablative radiation on local tumor require CD8 + T cells: changing strategies for cancer treatment. Blood. 2009;114:589–595. - PMC - PubMed
    1. Garnett C.T., Palena C., Chakarborty M., Tsang K.Y., Schlom J., Hodge J.W. Sublethal irradiation of human tumor cells modulates phenotype resulting in enhanced killing by cytotoxic T lymphocytes. Cancer Res. 2004;64:7985–7994. - PubMed
    1. Burnette B., Weichselbaum R.R. Radiation as an immune modulator. Semin. Radiat. Oncol. 2013;23:273–280. - PubMed
    1. Reits E.A., Hodge J.W., Herberts C.A., Groothuis T.A., Chakraborty M., Wansley E.K., et al. Radiation modulates the peptide repertoire, enhances MHC class I expression, and induces successful antitumor immunotherapy. J. Exp. Med. 2006;203:1259–1271. - PMC - PubMed
    1. Abdel-Wahab Z., Dar M.M., Hester D., Vervaert C., Gangavalli R., Barber J., et al. Effect of irradiation on cytokine production, MHC antigen expression, and vaccine potential of interleukin-2 and interferon-γ gene-modified melanoma cells. Cell Immunol. 1996;171:246–254. - PubMed

Publication types