Revisiting the growth rate hypothesis: Towards a holistic stoichiometric understanding of growth
- PMID: 36089849
- PMCID: PMC9595043
- DOI: 10.1111/ele.14096
Revisiting the growth rate hypothesis: Towards a holistic stoichiometric understanding of growth
Abstract
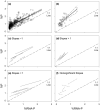
The growth rate hypothesis (GRH) posits that variation in organismal stoichiometry (C:P and N:P ratios) is driven by growth-dependent allocation of P to ribosomal RNA. The GRH has found broad but not uniform support in studies across diverse biota and habitats. We synthesise information on how and why the tripartite growth-RNA-P relationship predicted by the GRH may be uncoupled and outline paths for both theoretical and empirical work needed to broaden the working domain of the GRH. We found strong support for growth to RNA (r2 = 0.59) and RNA-P to P (r2 = 0.63) relationships across taxa, but growth to P relationships were relatively weaker (r2 = 0.09). Together, the GRH was supported in ~50% of studies. Mechanisms behind GRH uncoupling were diverse but could generally be attributed to physiological (P accumulation in non-RNA pools, inactive ribosomes, translation elongation rates and protein turnover rates), ecological (limitation by resources other than P), and evolutionary (adaptation to different nutrient supply regimes) causes. These factors should be accounted for in empirical tests of the GRH and formalised mathematically to facilitate a predictive understanding of growth.
Keywords: RNA; carbon; ecological stoichiometry; growth rate hypothesis; nitrogen; phosphorus; protein.
© 2022 The Authors. Ecology Letters published by John Wiley & Sons Ltd.
Figures


Similar articles
-
Optimization of biomass composition explains microbial growth-stoichiometry relationships.Am Nat. 2011 Feb;177(2):E29-42. doi: 10.1086/657684. Am Nat. 2011. PMID: 21460549
-
Biological stoichiometry in human cancer.PLoS One. 2007 Oct 10;2(10):e1028. doi: 10.1371/journal.pone.0001028. PLoS One. 2007. PMID: 17925876 Free PMC article.
-
Testing the Growth Rate Hypothesis in Two Wetland Macrophytes Under Different Water Level and Sediment Type Conditions.Front Plant Sci. 2020 Aug 5;11:1191. doi: 10.3389/fpls.2020.01191. eCollection 2020. Front Plant Sci. 2020. PMID: 32849739 Free PMC article.
-
Differential nutrient limitation of soil microbial biomass and metabolic quotients (qCO2): is there a biological stoichiometry of soil microbes?PLoS One. 2013;8(3):e57127. doi: 10.1371/journal.pone.0057127. Epub 2013 Mar 19. PLoS One. 2013. PMID: 23526933 Free PMC article. Review.
-
Biological stoichiometry: a chemical bridge between ecosystem ecology and evolutionary biology.Am Nat. 2006 Dec;168 Suppl 6:S25-35. doi: 10.1086/509048. Am Nat. 2006. PMID: 17109326 Review.
Cited by
-
Spatiotemporal Variation in Dissolved, Bioavailable, and Particulate Elements and the Abundance of Harmful Algae in Grand Lake.ACS ES T Water. 2024 Nov 27;4(12):5492-5505. doi: 10.1021/acsestwater.4c00575. eCollection 2024 Dec 13. ACS ES T Water. 2024. PMID: 39698556 Free PMC article.
-
Intraspecific trait variation modulates the temperature effect on elemental quotas and stoichiometry in marine Synechococcus.PLoS One. 2024 Mar 18;19(3):e0292337. doi: 10.1371/journal.pone.0292337. eCollection 2024. PLoS One. 2024. PMID: 38498438 Free PMC article.
-
Understanding stoichiometric constraints on growth using resource use efficiency imbalances.Proc Natl Acad Sci U S A. 2024 May 7;121(19):e2319022121. doi: 10.1073/pnas.2319022121. Epub 2024 Apr 29. Proc Natl Acad Sci U S A. 2024. PMID: 38683986 Free PMC article.
-
Microeukaryote metabolism across the western North Atlantic Ocean revealed through autonomous underwater profiling.Nat Commun. 2024 Aug 25;15(1):7325. doi: 10.1038/s41467-024-51583-4. Nat Commun. 2024. PMID: 39183190 Free PMC article.
-
Physiology, fast and slow: bacterial response to variable resource stoichiometry and dilution rate.mSystems. 2024 Aug 20;9(8):e0077024. doi: 10.1128/msystems.00770-24. Epub 2024 Jul 9. mSystems. 2024. PMID: 38980051 Free PMC article.
References
-
- Andersen, T. (1997) Herbivores and algae: food utilization, growth and reproduction in generalist filter feeders. In: Pelagic Nutrient Cycles, Ecological Studies. Berlin: Springer, pp. 63–115.
-
- Andersen, T. , Elser, J.J. & Hessen, D.O. (2004) Stoichiometry and population dynamics. Ecology Letters, 7, 884–900.
-
- Andersen, T. & Hessen, D.O. (1991) Carbon, nitrogen, and phosphorus content of freshwater zooplankton. Limnology and Oceanography, 36, 807–814.
-
- Barañano, D.E. , Wolosker, H. , Bae, B.‐I. , Barrow, R.K. , Snyder, S.H. & Ferris, C.D. (2000) A mammalian iron ATPase induced by iron. The Journal of Biological Chemistry, 275, 15166–15173. - PubMed
-
- Beck, M. , Mondy, C.P. , Danger, M. , Billoir, E. & Usseglio‐Polatera, P. (2021) Extending the growth rate hypothesis to species development: can stoichiometric traits help to explain the composition of macroinvertebrate communities? Oikos, 130, 879–892.
Publication types
MeSH terms
Substances
Grants and funding
LinkOut - more resources
Full Text Sources

