

How broad is the selfing syndrome? Insights from convergent evolution of gene expression across species and tissues in the Capsella genus
- PMID: 36089898
- PMCID: PMC9828073
- DOI: 10.1111/nph.18477
How broad is the selfing syndrome? Insights from convergent evolution of gene expression across species and tissues in the Capsella genus
Abstract
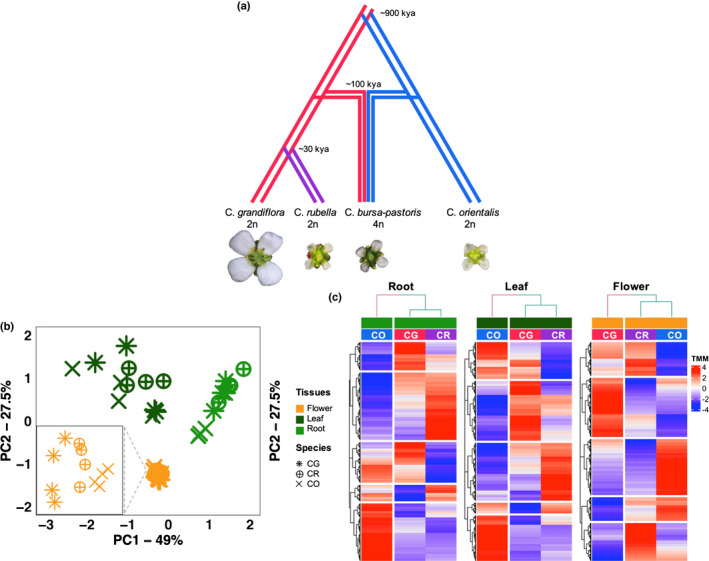
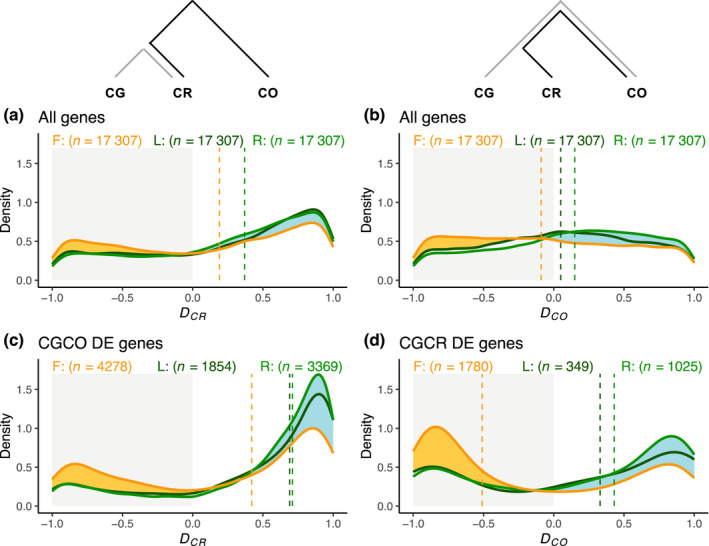
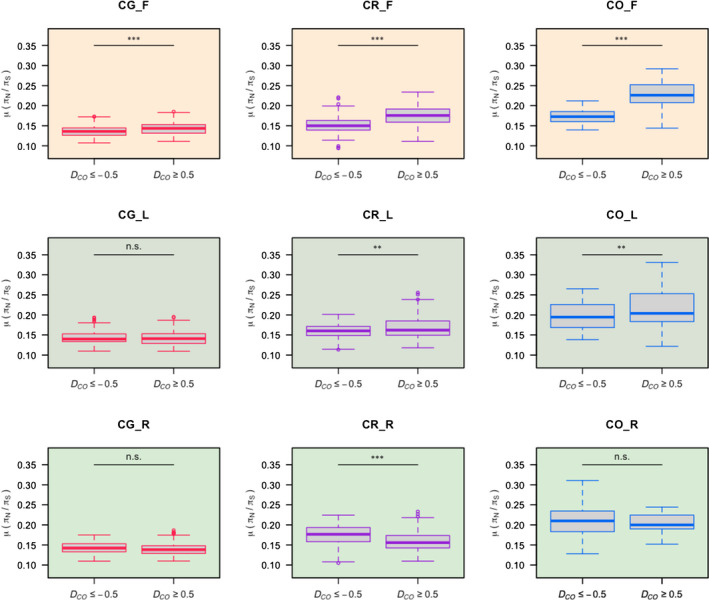
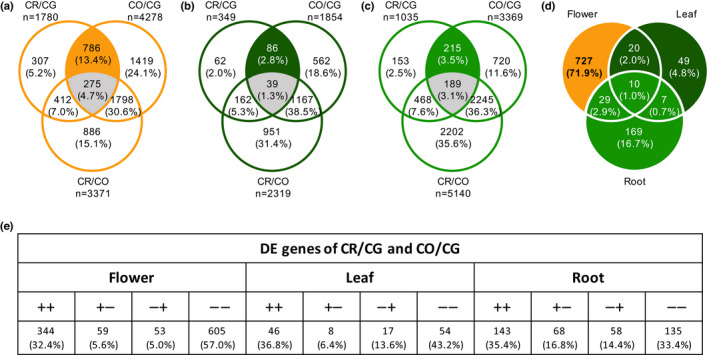
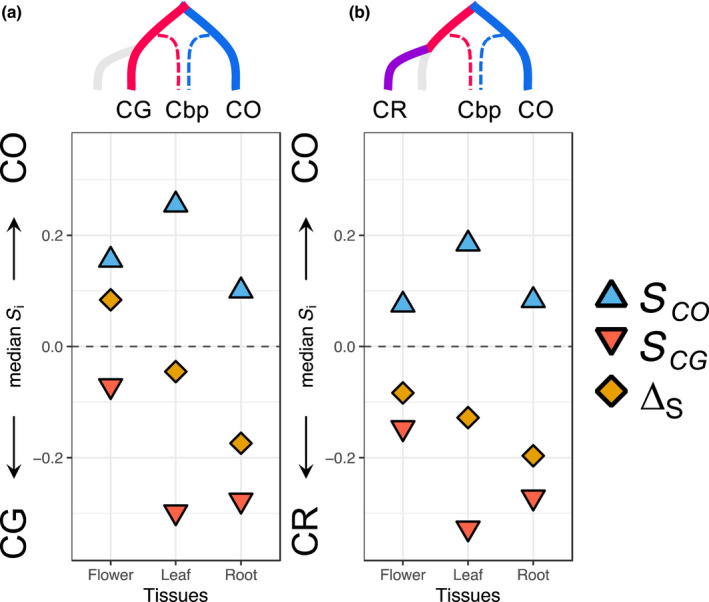
The shift from outcrossing to selfing is one of the main evolutionary transitions in plants. It is accompanied by profound effects on reproductive traits, the so-called selfing syndrome. Because the transition to selfing also implies deep genomic and ecological changes, one also expects to observe a genomic selfing syndrome. We took advantage of the three independent transitions from outcrossing to selfing in the Capsella genus to characterize the overall impact of mating system change on RNA expression, in flowers but also in leaves and roots. We quantified the extent of both selfing and genomic syndromes, and tested whether changes in expression corresponded to adaptation to selfing or to relaxed selection on traits that were constrained in outcrossers. Mating system change affected gene expression in all three tissues but more so in flowers than in roots and leaves. Gene expression in selfing species tended to converge in flowers but diverged in the two other tissues. Hence, convergent adaptation to selfing dominates in flowers, whereas genetic drift plays a more important role in leaves and roots. The effect of mating system transition is not limited to reproductive tissues and corresponds to both adaptation to selfing and relaxed selection on previously constrained traits.
Keywords: Capsella; convergent adaptation; gene expression; genomic and selfing syndromes; mating system change; relaxed selection.
© 2022 The Authors. New Phytologist © 2022 New Phytologist Foundation.
Figures
Similar articles
-
Cis-Regulatory Changes Associated with a Recent Mating System Shift and Floral Adaptation in Capsella.Mol Biol Evol. 2015 Oct;32(10):2501-14. doi: 10.1093/molbev/msv169. Epub 2015 Aug 28. Mol Biol Evol. 2015. PMID: 26318184 Free PMC article.
-
Competitive ability of Capsella species with different mating systems and ploidy levels.Ann Bot. 2018 May 11;121(6):1257-1264. doi: 10.1093/aob/mcy014. Ann Bot. 2018. PMID: 29471370 Free PMC article.
-
The selfing syndrome and beyond: diverse evolutionary consequences of mating system transitions in plants.Philos Trans R Soc Lond B Biol Sci. 2022 Jul 18;377(1855):20200510. doi: 10.1098/rstb.2020.0510. Epub 2022 May 30. Philos Trans R Soc Lond B Biol Sci. 2022. PMID: 35634918 Free PMC article. Review.
-
Genetic architecture and adaptive significance of the selfing syndrome in Capsella.Evolution. 2012 May;66(5):1360-74. doi: 10.1111/j.1558-5646.2011.01540.x. Epub 2012 Mar 3. Evolution. 2012. PMID: 22519777 Free PMC article.
-
The selfing syndrome: a model for studying the genetic and evolutionary basis of morphological adaptation in plants.Ann Bot. 2011 Jun;107(9):1433-43. doi: 10.1093/aob/mcr023. Epub 2011 Feb 7. Ann Bot. 2011. PMID: 21303786 Free PMC article. Review.
Cited by
-
Effects of mode of reproduction on genetic polymorphism and divergence in wild yams (Dioscoreaceae: Dioscorea).Plant Divers. 2024 Sep 25;47(1):136-147. doi: 10.1016/j.pld.2024.09.009. eCollection 2025 Jan. Plant Divers. 2024. PMID: 40041563 Free PMC article.
-
When numbers matter: Rethinking the role of gene duplication on short evolutionary timescales.Am J Bot. 2025 Jul;112(7):e70072. doi: 10.1002/ajb2.70072. Epub 2025 Jul 9. Am J Bot. 2025. PMID: 40635231 Free PMC article. No abstract available.
-
Can ploidy changes propel the evolution of allogamy in a selfing species complex?BMC Plant Biol. 2025 Aug 1;25(1):1011. doi: 10.1186/s12870-025-06868-1. BMC Plant Biol. 2025. PMID: 40750839 Free PMC article.
-
Identification of Candidate Genes for Economically Important Carcass Cutting in Commercial Pigs through GWAS.Animals (Basel). 2023 Oct 18;13(20):3243. doi: 10.3390/ani13203243. Animals (Basel). 2023. PMID: 37893967 Free PMC article.
-
Selfing Shapes Fixation of a Mutant Allele Under Flux Equilibrium.Genome Biol Evol. 2024 Dec 4;16(12):evae261. doi: 10.1093/gbe/evae261. Genome Biol Evol. 2024. PMID: 39656771 Free PMC article.
References
-
- Alexa A, Rahnenfuhrer J. 2020. topGO: enrichment analysis for gene ontology 2.40.0. R package v.2(0) [WWW document] URL http://www.bioconductor.org/packages/release/bioc/html/topGO.html.
-
- Arunkumar R, Maddison TI, Barrett SCH, Wright SI. 2016. Recent mating‐system evolution in Eichhornia is accompanied by cis‐regulatory divergence. New Phytologist 211: 697–707. - PubMed
-
- Bachmann JA, Tedder A, Laenen B, Fracassetti M, Désamoré A, Lafon‐Placette C, Steige KA, Callot C, Marande W, Neuffer B et al. 2019. Genetic basis and timing of a major mating system shift in Capsella . New Phytologist 224: 505–517. - PubMed
-
- Barrett SCH. 2002. The evolution of plant sexual diversity. Nature Reviews. Genetics 3: 274–284. - PubMed
-
- Barth C, Tullio MD, Conklin PL. 2006. The role of ascorbic acid in the control of flowering time and the onset of senescence. Journal of Experimental Botany 57: 1657–1665. - PubMed
Publication types
MeSH terms
LinkOut - more resources
Full Text Sources
