. 2022 Aug 26:9:932261.
doi: 10.3389/fmolb.2022.932261. eCollection 2022.

Comparison of extraction methods for intracellular metabolomics of human tissues

Affiliations

Comparison of extraction methods for intracellular metabolomics of human tissues

Carolin Andresen et al. Front Mol Biosci. .

Abstract

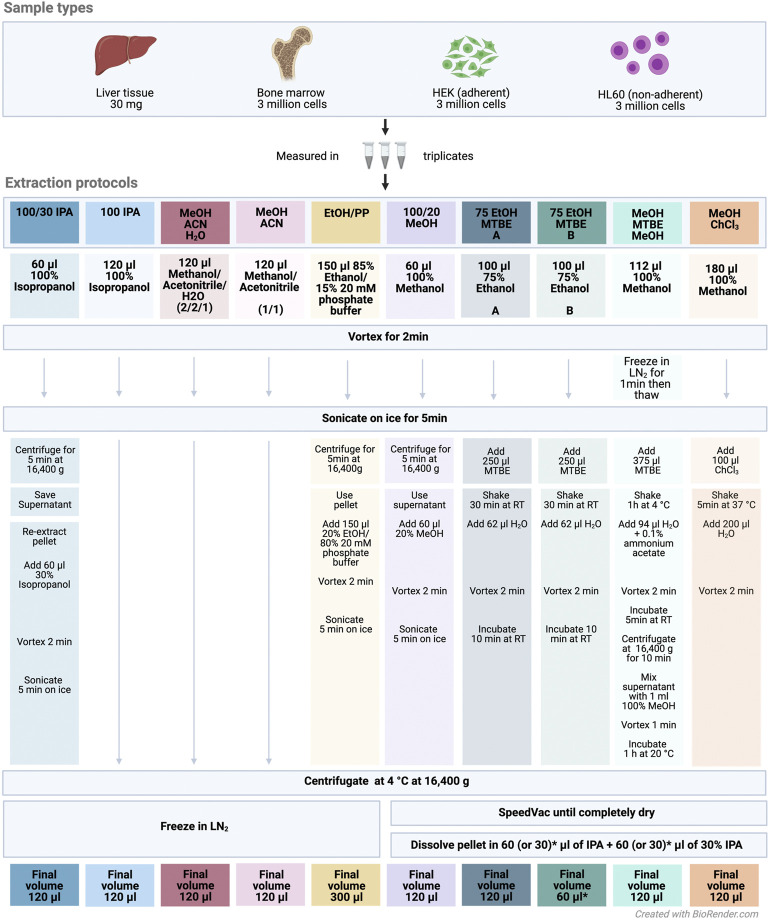
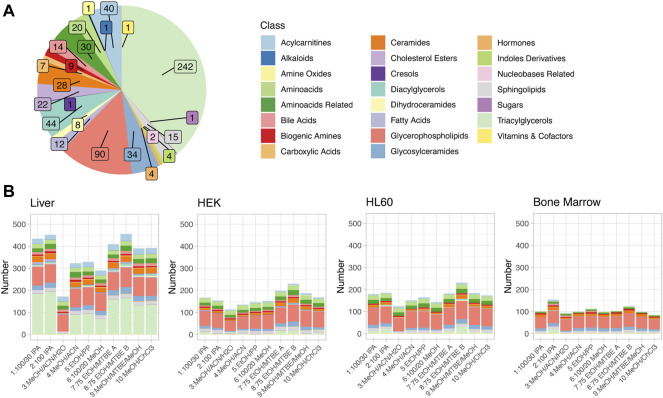
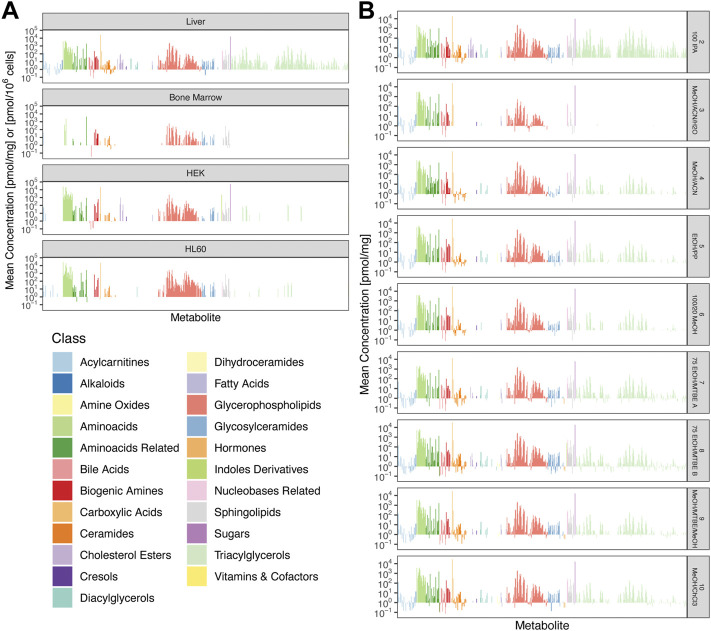
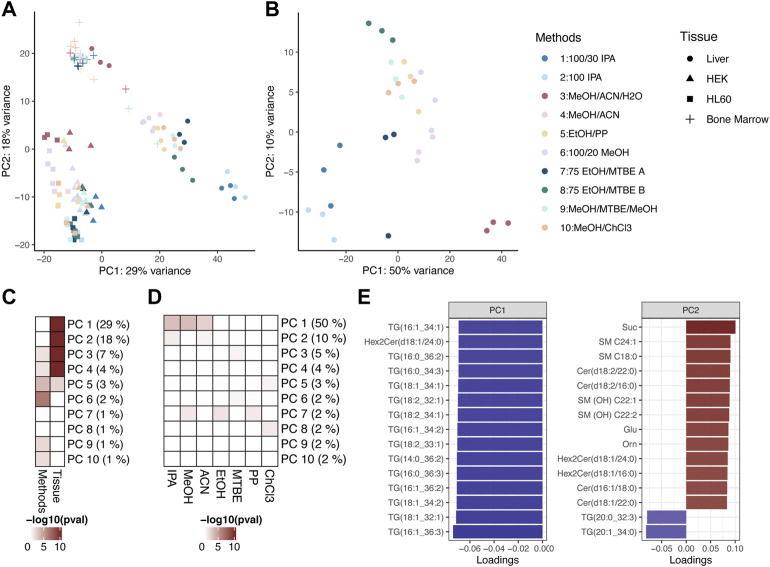
Analyses of metabolic compounds inside cells or tissues provide high information content since they represent the endpoint of biological information flow and are a snapshot of the integration of many regulatory processes. However, quantification of the abundance of metabolites requires their careful extraction. We present a comprehensive study comparing ten extraction protocols in four human sample types (liver tissue, bone marrow, HL60, and HEK cells) aiming to detect and quantify up to 630 metabolites of different chemical classes. We show that the extraction efficiency and repeatability are highly variable across protocols, tissues, and chemical classes of metabolites. We used different quality metrics including the limit of detection and variability between replicates as well as the sum of concentrations as a global estimate of analytical repeatability of the extraction. The coverage of extracted metabolites depends on the used solvents, which has implications for the design of measurements of different sample types and metabolic compounds of interest. The benchmark dataset can be explored in an easy-to-use, interactive, and flexible online resource (R/shiny app MetaboExtract: http://www.metaboextract.shiny.dkfz.de) for context-specific selection of the optimal extraction method. Furthermore, data processing and conversion functionality underlying the shiny app are accessible as an R package: https://cran.r-project.org/package=MetAlyzer.

Keywords: absolute quantification; extraction protocol; intra-cellular; metabolism; metabolomics.


Conflict of interest statement

The authors declare that the research was conducted in the absence of any commercial or financial relationships that could be construed as a potential conflict of interest.

Figures

FIGURE 1
FIGURE 1
Experimental design and extraction protocol overview. Abbreviations: IPA, isopropanol; MTBE, methyl tert-butyl ether; ACN, acetonitrile; EtOH, ethanol; MeOH, methanol; PP, polypropylene; ChCl3, chloroform; LN2, liquid nitrogen; RT, room temperature. All sample types were measured in triplicates across the extraction protocols. The colors denote the different extraction protocols.
FIGURE 2
FIGURE 2
(A) Metabolites detectable via the Biocrates MxP® Quant 500 kit. Colors encode the different metabolite classes. Numbers of metabolites per class are indicated by the inset. (B) Metabolites above the limit of detection (LOD) in the four different sample types and for all extraction protocols. The same color code is used as in (A).
FIGURE 3
FIGURE 3
Statistics for each extraction method and tissue type. (A) Summary statistics of numbers of metabolites above the LOD. (B) Numbers of metabolites with coefficients of variation (CV) below 30%. (C) Median and median absolute deviation (MAD) for the CVs. (D) Distributions of CVs are displayed as histograms for different tissues and extraction methods (only metabolites above LOD). Color code applies to all items.
FIGURE 4
FIGURE 4
Mean absolute concentrations between replicates. (A) Comparison of all four cell types for 8: 75 EtOH/MTBE (B). Concentrations of bone marrow, HEK, and HL60 samples are plotted as pmol/106 cells and pmol/mg for liver tissue. (B) Comparison of all additional extraction protocols for liver tissue. Colors encode metabolite classes as in (A).
FIGURE 5
FIGURE 5
(A) PCA of the ten different extraction protocols used across all sample types. (B) PCA of the ten different extraction protocols used on liver tissue samples. Colors encode metabolite classes as in (B). (C) Heatmap showing association strength between PCs and experimental setting (extraction protocol or tissue), color coding by the p-value of the Kruskal-Wallis test. (D) Heatmap showing association strength between PCs and solvents used in extraction protocols, color coding by the p-value of the Kruskal–Wallis test. (E) Barplot of the 15 highest (ranked by absolute value) loadings for PC1 and PC2. The color encodes the signs of the loadings.

References

    1. Aurpibul L., Namwongprom S., Sudjaritruk T., Ounjaijean S. (2020). Metabolic syndrome, biochemical markers, and body composition in youth living with perinatal HIV infection on antiretroviral treatment. PLoS One 15, e0230707. 10.1371/journal.pone.0230707 - DOI - PMC - PubMed
    1. Banerjee S., Zare R. N., Tibshirani R. J., Kunder C. A., Nolley R., Fan R., et al. (2017). Diagnosis of prostate cancer by desorption electrospray ionization mass spectrometric imaging of small metabolites and lipids. Proc. Natl. Acad. Sci. U. S. A. 114, 3334–3339. 10.1073/pnas.1700677114 - DOI - PMC - PubMed
    1. Blennow K., Zetterberg H. (2018). Biomarkers for alzheimer’s disease: current status and prospects for the future. J. Intern. Med. 284, 643–663. 10.1111/joim.12816 - DOI - PubMed
    1. Burla B., Arita M., Arita M., Bendt A. K., Cazenave-Gassiot A., Dennis E. A., et al. (2018). MS-based lipidomics of human blood plasma: a community-initiated position paper to develop accepted guidelines. J. Lipid Res. 59, 2001–2017. 10.1194/jlr.S087163 - DOI - PMC - PubMed
    1. Calderón C., Sanwald C., Schlotterbeck J., Drotleff B., Lämmerhofer M. (2019). Comparison of simple monophasic versus classical biphasic extraction protocols for comprehensive UHPLC-MS/MS lipidomic analysis of Hela cells. Anal. Chim. Acta 1048, 66–74. 10.1016/j.aca.2018.10.035 - DOI - PubMed