

Epidemiological characteristics and transmission dynamics of the outbreak caused by the SARS-CoV-2 Omicron variant in Shanghai, China: A descriptive study
- PMID: 36090701
- PMCID: PMC9448412
- DOI: 10.1016/j.lanwpc.2022.100592
Epidemiological characteristics and transmission dynamics of the outbreak caused by the SARS-CoV-2 Omicron variant in Shanghai, China: A descriptive study
Abstract
Background: In early March 2022, a major outbreak of the severe acute respiratory syndrome coronavirus 2 (SARS-CoV-2) Omicron variant spread rapidly throughout Shanghai, China. Here we aimed to provide a description of the epidemiological characteristics and spatiotemporal transmission dynamics of the Omicron outbreak under the population-based screening and lockdown policies implemented in Shanghai.
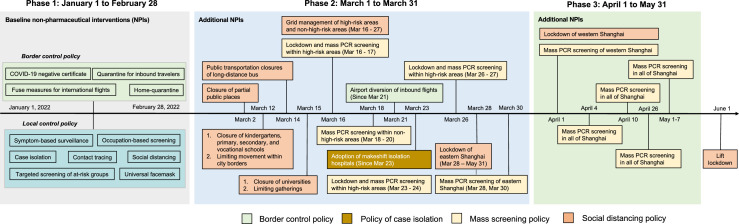
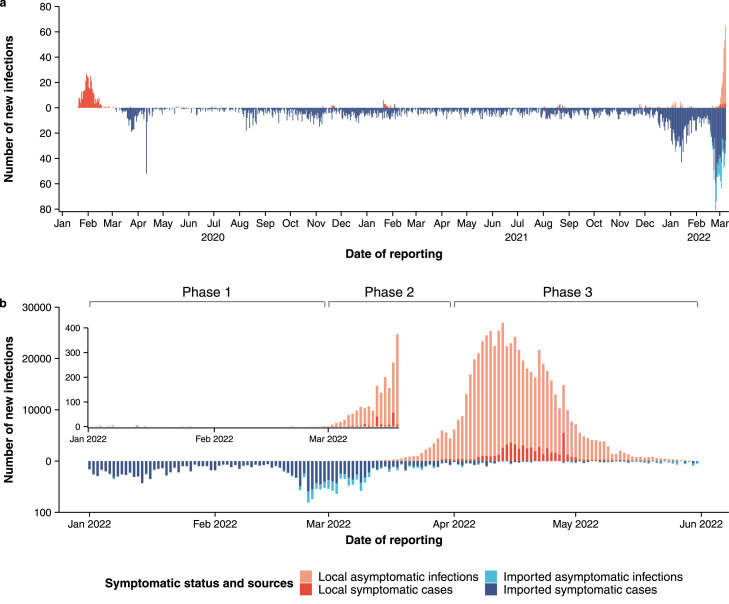
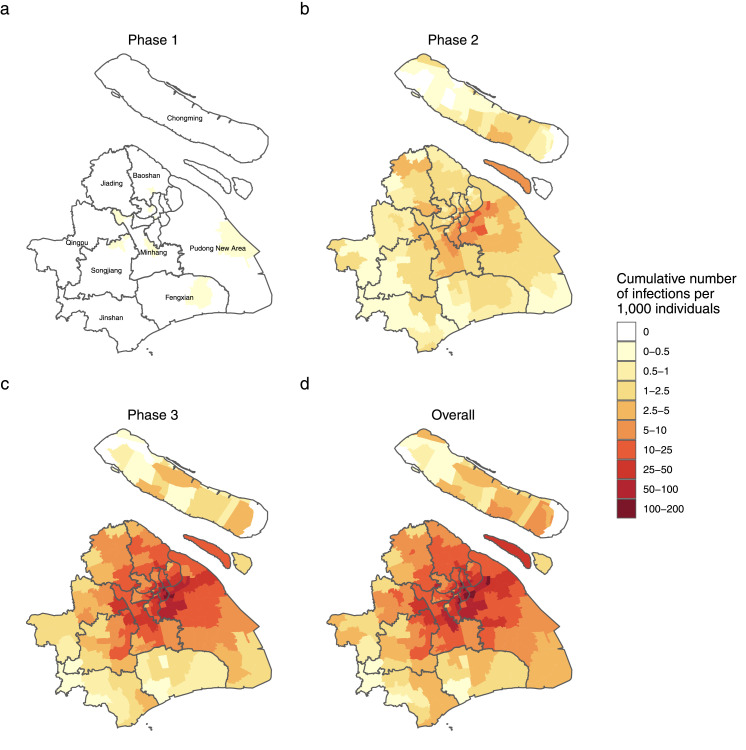
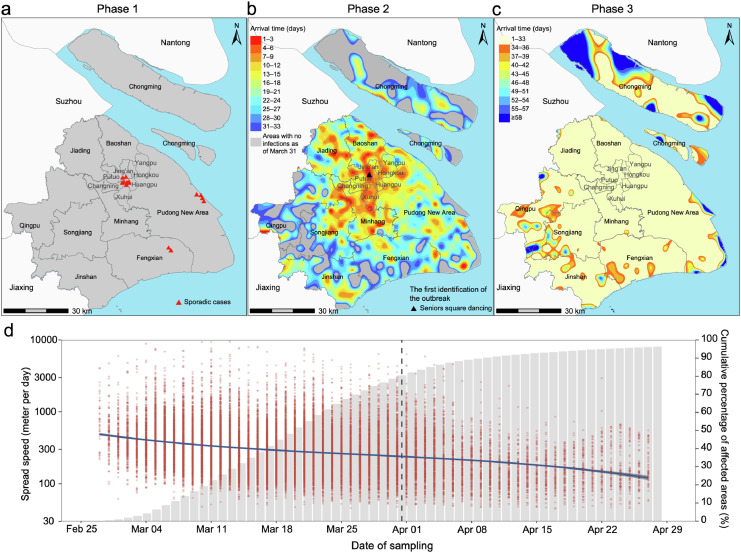
Methods: We extracted individual information on SARS-CoV-2 infections reported between January 1 and May 31, 2022, and on the timeline of the adopted non-pharmaceutical interventions. The epidemic was divided into three phases: i) sporadic infections (January 1-February 28), ii) local transmission (March 1-March 31), and iii) city-wide lockdown (April 1 to May 31). We described the epidemic spread during these three phases and the subdistrict-level spatiotemporal distribution of the infections. To evaluate the impact on the transmission of SARS-CoV-2 of the adopted targeted interventions in Phase 2 and city-wide lockdown in Phase 3, we estimated the dynamics of the net reproduction number (Rt ).
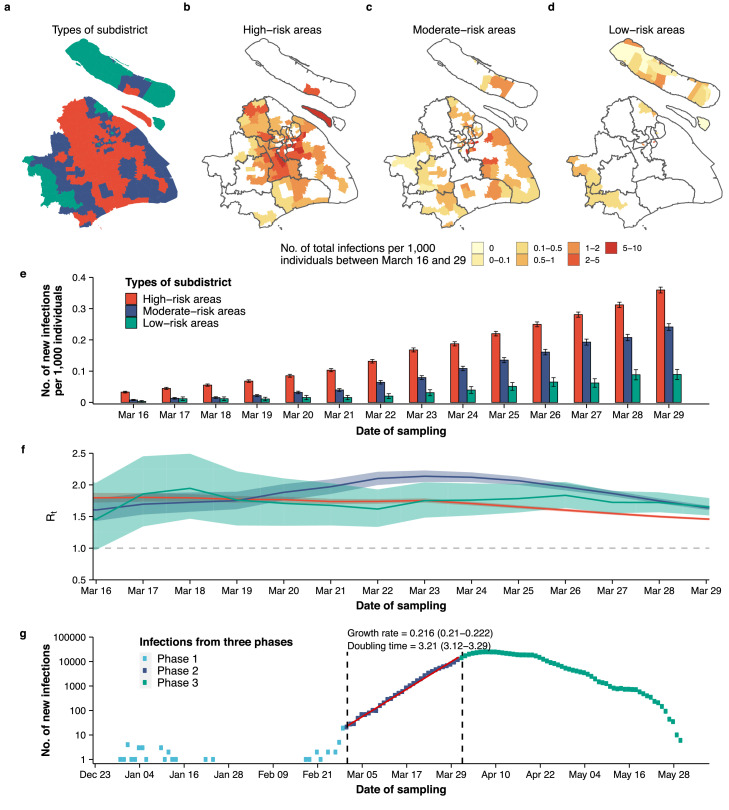
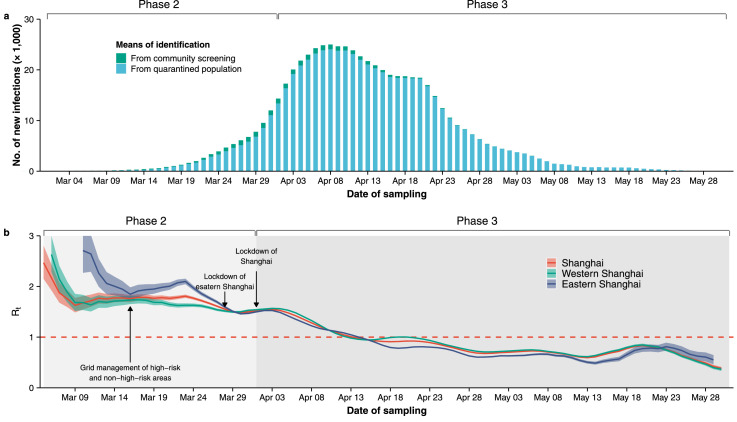
Findings: A surge in imported infections in Phase 1 triggered cryptic local transmission of the Omicron variant in early March, resulting in the largest outbreak in mainland China since the original wave. A total of 626,000 SARS-CoV-2 infections were reported in 99.5% (215/216) of the subdistricts of Shanghai until the end of May. The spatial distribution of the infections was highly heterogeneous, with 37% of the subdistricts accounting for 80% of all infections. A clear trend from the city center towards adjacent suburban and rural areas was observed, with a progressive slowdown of the epidemic spread (from 463 to 244 meters/day) prior to the citywide lockdown. During Phase 2, Rt remained well above 1 despite the implementation of multiple targeted interventions. The citywide lockdown imposed on April 1 led to a marked decrease in transmission, bringing Rt below the epidemic threshold in the entire city on April 14 and ultimately leading to containment of the outbreak.
Interpretation: Our results highlight the risk of widespread outbreaks in mainland China, particularly under the heightened pressure of imported infections. The targeted interventions adopted in March 2022 were not capable of halting transmission, and the implementation of a strict, prolonged city-wide lockdown was needed to successfully contain the outbreak, highlighting the challenges for containing Omicron outbreaks.
Funding: Key Program of the National Natural Science Foundation of China (82130093); Shanghai Rising-Star Program (22QA1402300).
Keywords: Non-pharmaceutical intervention; Omicron; SARS-CoV-2; Shanghai outbreak; Transmission dynamics.
© 2022 The Author(s).
Conflict of interest statement
H.Y. has received research funding from Sanofi Pasteur, GlaxoSmithKline, Yichang HEC Changjiang Pharmaceutical Company, Shanghai Roche Pharmaceutical Company, and SINOVAC Biotech Ltd. M.A. has received research funding from Seqirus. None of those research funding is related to this work. All other authors report no competing interests.
Figures
Update of
-
Epidemiological characteristics and transmission dynamics of the outbreak caused by the SARS-CoV-2 Omicron variant in Shanghai, China: a descriptive study.medRxiv [Preprint]. 2022 Jun 18:2022.06.11.22276273. doi: 10.1101/2022.06.11.22276273. medRxiv. 2022. Update in: Lancet Reg Health West Pac. 2022 Dec;29:100592. doi: 10.1016/j.lanwpc.2022.100592. PMID: 35765564 Free PMC article. Updated. Preprint.
References
-
- World Health Organization. Tracking SARS-CoV-2 variants. 2022. - PubMed
LinkOut - more resources
Full Text Sources
Miscellaneous
