. 2022 Aug 17:29:749-768.
doi: 10.1016/j.omtn.2022.08.018. eCollection 2022 Sep 13.

Characterizing isoform switching events in esophageal adenocarcinoma

Affiliations

Characterizing isoform switching events in esophageal adenocarcinoma

Yun Zhang et al. Mol Ther Nucleic Acids. .

Abstract

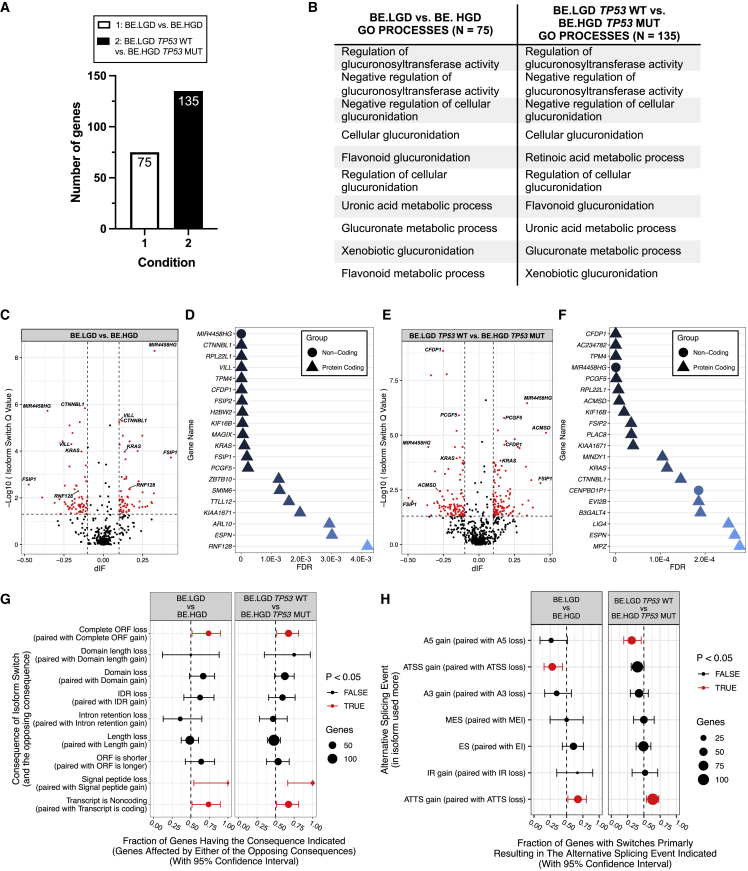
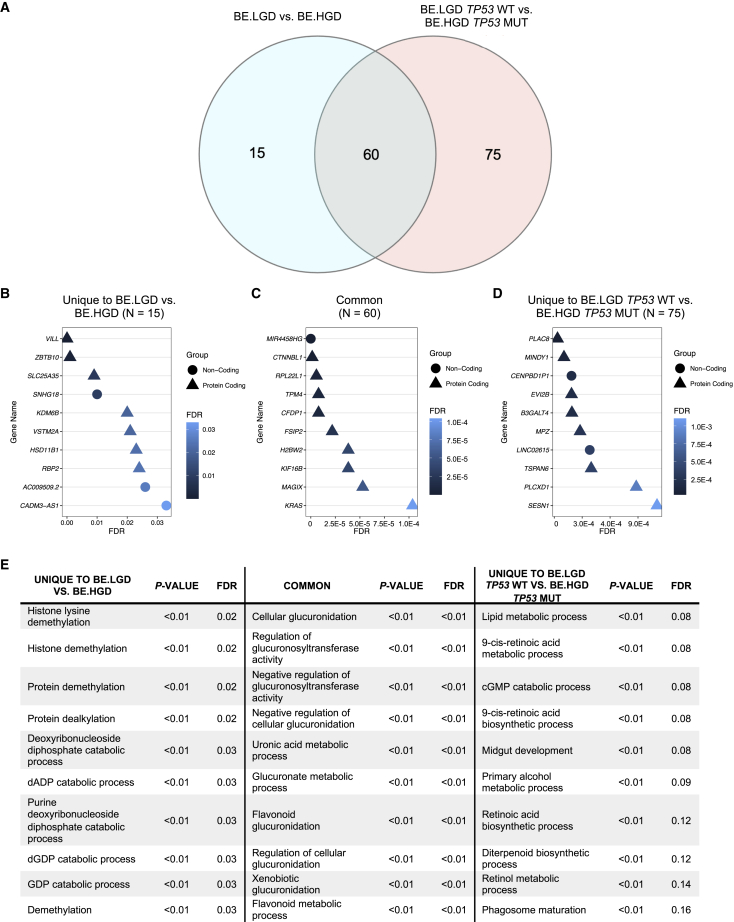
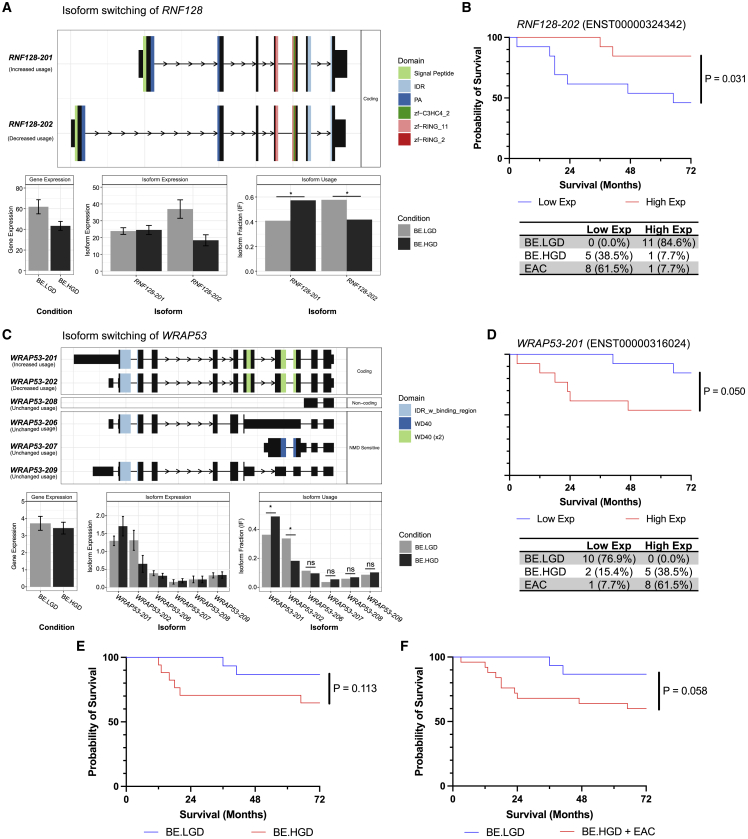
Isoform switching events with predicted functional consequences are common in many cancers, but characterization of switching events in esophageal adenocarcinoma (EAC) is lacking. Next-generation sequencing was used to detect levels of RNA transcripts and identify specific isoforms in treatment-naïve esophageal tissues ranging from premalignant Barrett's esophagus (BE), BE with low- or high-grade dysplasia (BE.LGD, BE.HGD), and EAC. Samples were stratified by histopathology and TP53 mutation status, identifying significant isoform switching events with predicted functional consequences. Comparing BE.LGD with BE.HGD, a histopathology linked to cancer progression, isoform switching events were identified in 75 genes including KRAS, RNF128, and WRAP53. Stratification based on TP53 status increased the number of significant isoform switches to 135, suggesting switching events affect cellular functions based on TP53 mutation and tissue histopathology. Analysis of isoforms agnostic, exclusive, and shared with mutant TP53 revealed unique signatures including demethylation, lipid and retinoic acid metabolism, and glucuronidation, respectively. Nearly half of isoform switching events were identified without significant gene-level expression changes. Importantly, two TP53-interacting isoforms, RNF128 and WRAP53, were significantly linked to patient survival. Thus, analysis of isoform switching events may provide new insight for the identification of prognostic markers and inform new potential therapeutic targets for EAC.

Keywords: Barrett’s esophagus; MT: Bioinformatics; Mortality-linked isoforms; TP53; esophageal adenocarcinoma; isoform switching; transcriptomics.


Conflict of interest statement

The authors declare no competing interests.

Figures

None
Graphical abstract
Figure 1
Figure 1
Identification of significant isoform switching events with predicted functional consequences based on histopathology and TP53 status (A) Number of isoform-switched genes detected in Barrett’s esophagus with metaplasia and low-grade dysplasia (BE.LGD) compared with BE with high-grade dysplasia (BE.HGD) and with inclusion of TP53 mutation status, wild-type (WT) or mutant (MUT). (B) Top 10 GO processes identified for each comparison (p < 0.001 and FDR <0.001), ranked by FDR value. (C) Volcano plot showing the differential isoform fraction (dIF) values comparing BE.LGD with BE.HGD. Each dot represents a transcript involved in isoform switching. In red are isoforms with |dIF| ≥ 0.1 and FDR ≤0.05. (D) Dot plot showing top 20 genes with significant isoform switching events for BE.LGD versus BE.HGD. The shape of each dot represents gene category and the color of each dot indicates significance level (|dIF| ≥ 0.1 and FDR ≤ 0.05). (E) Volcano plot showing dIF values in BE.LGD TP53 WT versus BE.HGD TP53 MUT. Each dot represents a transcript involved in isoform switching. In red are isoforms with |dIF| ≥ 0.1 and FDR ≤0.05. (F) Dot plot showing top 20 genes with significant isoform switching events BE.LGD TP53 WT versus BE.HGD TP53 MUT (|dIF| ≥ 0.1 and FDR ≤ 0.05). (G) Dot plot showing functional consequences analysis associated with isoform switching. (H) Dot plot showing global alternative splicing event analysis. The size of the dot indicates the number of isoform-switched genes in each category and the line indicates 95% confidence interval. Significant changes in functional consequences and global alternative splicing events are colored in red (p ≤ 0.05).
Figure 2
Figure 2
Changes associated with RNA regulatory proteins and RNA-binding proteins on the gene-level data (A) GO pathway enrichments associated with RNA regulatory proteins identified in BE.LGD versus BE.HGD and BE.LGD TP53 WT versus BE.HGD TP53 MUT (p-value ≤ 0.05 and FDR ≤0.25). Pathways are colored and ranked by FDR. (B) Heatmap of the leading-edge genes identified in select pathways in the GO pathway enrichment analysis. Dot plot on the right shows the pathways that the gene belongs. (C) Volcano plot of the expression of RNA-binding proteins (RBPs) in BE.LGD versus BE.HGD. (D) Volcano plot of the expression of RBPs in BE.LGD TP53 WT versus BE.HGD TP53 MUT. Red dot represents significantly differentially expressed RBPs (|log2FC| > 0.585 and FDR ≤0.05). Gene names of the genes that interact with isoform-switched genes predicted by the STRING database are shown.
Figure 3
Figure 3
GO processes associated with significant isoform switching based on histopathology and TP53 mutation status (A) Venn diagram showing 15 unique genes involved in isoform switching in BE.LGD versus BE.HGD, 75 unique genes involved in isoform switching in BE.LGD TP53 WT versus BE.HGD TP53 MUT, and 60 genes shared. (B–D) Top 10 most significant isoform-switched genes in each section of the Venn diagram (|dIF| ≥ 0.1 and FDR ≤ 0.05). (E) GO enrichment analyses showing the top 10 enriched biological processes in each part of the Venn diagram (p < 0.01).
Figure 4
Figure 4
TP53-linked isoform switches predict patient survival (A) Isoform switching of RNF128. Transcripts involved in isoform switching of RNF128 and their predicted functional domain Error bars indicate 95% confidence intervals and significance levels of isoform usage were determined by the Mann–Whitney U test (∗ FDR ≤ 0.05). (B) Kaplan-Meier survival curve of patients stratified by expression level of RNF128 transcript ENST00000324342 and the histology proportion of patients in each group. (C) Isoform switching of WRAP53. Transcripts of WRAP53 and their corresponding isoform usage. Error bars indicate 95% confidence intervals and significance levels of isoform usage were determined by the Mann–Whitney U test, ns indicates no significant change, (∗ FDR ≤ 0.05). (D) Kaplan-Meier survival plot of patients stratified by expression of WRAP53 transcript ENST00000316024 and histology distribution of patients in each group. (E) Survival probability of BE.LGD or BE.HGD patient samples (n = 32). (F) Patient survival probability of BE.LGD or BE.HGD + EAC (n = 41). Only the most severe pathological sample for each patient was kept in the analysis if a patient contributed multiple biopsy samples. Significance of survival differences was calculated by the Gehan-Breslow-Wilcoxon test.
Figure 5
Figure 5
Enrichment analysis of isoform switching events supports retinoic acid and TP53 signaling pathway targeting to inhibit EAC growth (A) Viability of adapalene-treated OE33 cells measured using Calcein-AM staining 48 and 72 h post-treatment with (B) representative fluorescent images of adapalene-treated Calcein-AM stained OE33 cells. (C) Viability of adapalene-treated JHAD1 cells assessed using Calcein-AM 48 and 72 h post-treatment with (D) representative fluorescent images of adapalene-treated stained JHAD1 cells. (E) Viability of OE33 cells treated with APR-246 at 48 and 72 h post-treatment with (F) representative fluorescent images of stained OE33 cells treated with APR-246. (G) Viability of JHAD1 cells treated with APR-246 at 48 and 72 h post-treatment with (H) representative fluorescent images of stained JHAD1 cells treated with APR-246. Significant differences of viability were assessed by ANOVA with Tukey’s post hoc test for multiple comparisons between treatments. Within each time point, treatments were significantly different from a = vehicle (VEH), b = 1.0 μM adapalene or 10 μM APR-246, c = 1.5 μM adapalene or 20 μM APR-246, and d = 2.0 μM adapalene or 40 μM APR-246. Data are shown as mean ± standard error. Note: VEH-48h and VEH-72h images are the same in 5B and 5F because adapalene and APR-246 treatment of OE33 cells occurred in the same plate to permit direct comparisons. Similarly, VEH-48h and VEH-72h images are the same in 5D and 5H for JHAD1 cells. Scale bars, 500 μm.

Similar articles

Cited by

References

    1. Huang J., Koulaouzidis A., Marlicz W., Lok V., Chu C., Ngai C.H., Zhang L., Chen P., Wang S., Yuan J., et al. Global burden, risk factors, and trends of esophageal cancer: an analysis of cancer registries from 48 countries. Cancers. 2021;13:E141. - PMC - PubMed
    1. Klingelhöfer D., Zhu Y., Braun M., Brüggmann D., Schöffel N., Groneberg D.A. A world map of esophagus cancer research: a critical accounting. J. Transl. Med. 2019;17:150. - PMC - PubMed
    1. Siegel R.L., Miller K.D., Fuchs H.E., Jemal A. Cancer statistics, 2021. CA. Cancer J. Clin. 2021;71:7–33. - PubMed
    1. National Cancer Institute – Surveillance. Epidemiology and End Results Program (2022). Cancer Stat Facts. Esophageal Cancer. https://seer.cancer.gov/statfacts/html/esoph.html
    1. Domper Arnal M.J., Ferrández Arenas Á., Lanas Arbeloa Á. Esophageal cancer: risk factors, screening and endoscopic treatment in Western and Eastern countries. World J. Gastroenterol. 2015;21:7933–7943. - PMC - PubMed