. 2022 Aug 31:2022:5388283.
doi: 10.1155/2022/5388283. eCollection 2022.

Systematic Analysis and Identification of Molecular Subtypes of TRP-Related Genes and Prognosis Prediction in Lung Adenocarcinoma

Affiliations

Systematic Analysis and Identification of Molecular Subtypes of TRP-Related Genes and Prognosis Prediction in Lung Adenocarcinoma

Yang Guo et al. J Oncol. .

Abstract

Background: Transient receptor potential channel (TRP) is a superfamily of nonselective cation channels, which is a member of calcium ion channels with a vital role in different calcium ion signal transduction pathways. TRP channel expression is often changed in the tumor, although the role of TRP proteins in lung cancer is unknown.

Methods: Molecular Signatures Database (MsigDB) provided the TRP gene set. Univariate Cox regression analysis was performed on The Cancer Genome Atlas Lung Adenocarcinoma (TCGA-LUAD) data collection set employing the coxph function of R package survival to find prognosis-related genes. The R package ConsumusClusterPlus was employed for doing the consistency cluster analysis of TCGA-LUAD samples according to the prognosis-related TRP gene. The R-package limma was utilized for investigating the differential expression of TRP subtypes. According to the differentially expressed genes between subtypes, the least absolute shrinkage and selection operator (LASSO) regression was employed to find the major genes and develop the risk model. CIBERPORT algorithm, R package maftools, gene set variation analysis (GSVA), and pRRophetic of R-package were employed for measuring the proportion of immune cells among subtypes, genomic mutation difference, pathway enrichment score, and drug sensitivity analysis.

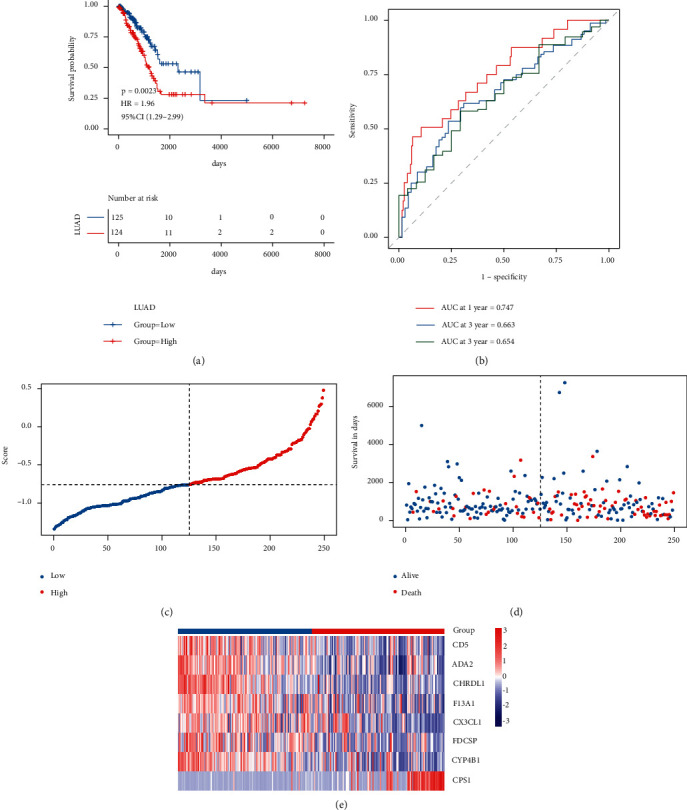
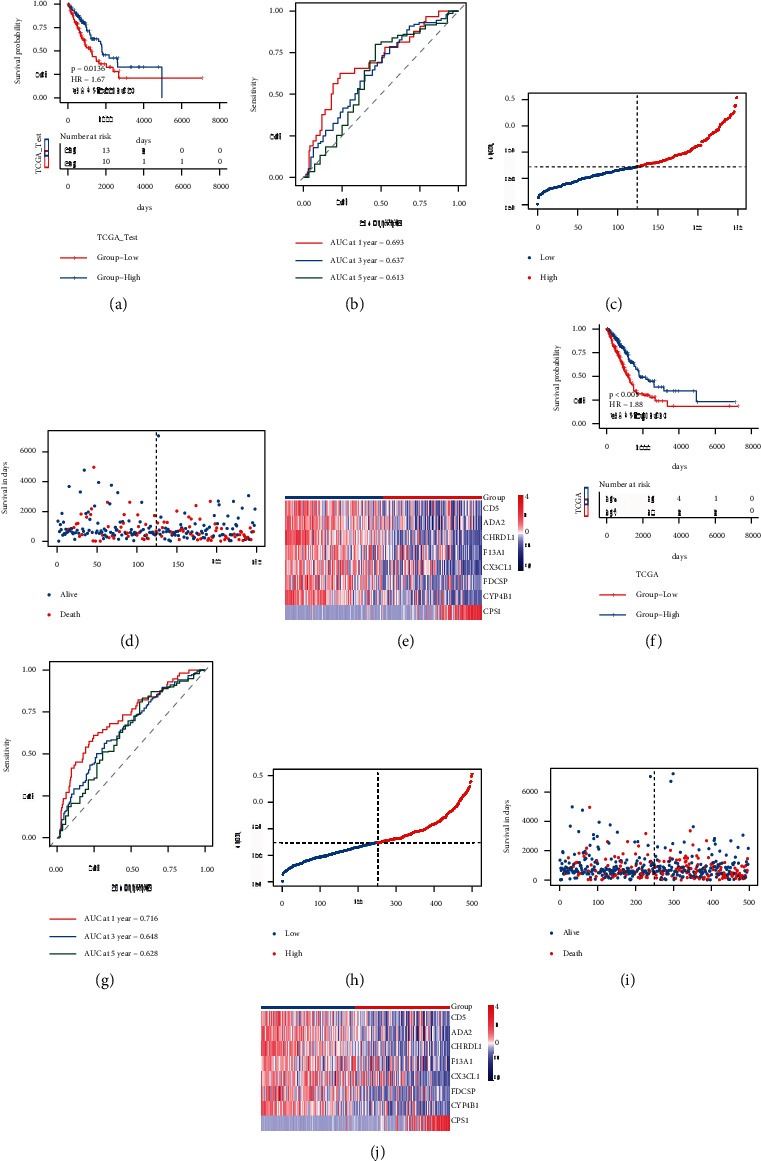
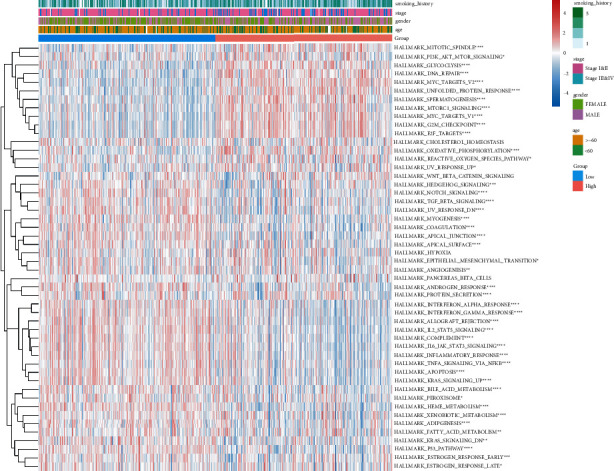
Results: A total of 15 TRP-related genes associated with the prognosis of lung adenocarcinoma were found. According to the expression value of 15 genes, lung adenocarcinoma can be sorted into two subcategories. The prognosis of cluster1 is considerably better in comparison with that of cluster2. There were 123 differentially expressed genes between C1 and C2 subtypes, including 6 up- and 117 downregulated genes. There were major variations in the tumor microenvironment between C1 and C2 subtypes. The proportion of CD8 T cells in the C1 subtype was considerably enhanced in comparison with that in the C2 subtype. We further discovered 123 differentially expressed genes among subtypes, and 8 key genes were obtained at the end. The risk score (RS) model developed by the 8-gene signature had good strength in the TCGA validation set, overall set, and Gene Expression Omnibus (GEO) external dataset. There were major variations in immune checkpoint gene expression, patient sensitivity to immunotherapeutic drugs, immune infiltration, and genomic mutations between high and low groups on the basis of RS.

Conclusions: The risk model developed on the basis of TRP-related genes can help in predicting the prognosis of patients suffering from lung adenocarcinoma and guide immunotherapy.


Conflict of interest statement

The authors declare that the research was conducted in the absence of any commercial or financial relationships that could be construed as a potential conflict of interest.

Figures

Figure 1
Figure 1
Survival curves of 15 TRP genes linked with LUAD prognosis. Red represents the high expression group, and blue represents the low expression group.
Figure 2
Figure 2
TRP molecular subtype recognition outcomes and survival differences among subtypes. (a)–(d): Clustering outcomes when the classification number k = 2, k = 3, k = 4, and k = 5; (f)–(i): survival curve when classification number k = 2, k = 3, k = 4, and k = 5; (e) CDF curve distribution of consistent clustering; (j) the area distribution under the CDF curve of consistent clustering.
Figure 3
Figure 3
Gene identification and functional enrichment analysis of differential gene expression in TRP subtypes. (a) Heat map of differentially expressed genes in TRP subtypes; (b) bubble diagram of enrichment pathway of KEGG, BP (biological process), MF (molecular function), and CC (cell component) of differentially expressed genes. The size of the dot indicated the number of genes enriched to the difference, and the color represents the significance of enrichment.
Figure 4
Figure 4
TRP subtype HALLMARKER pathway enrichment difference and immune infiltrating cell difference. (a) HALLMARKER pathway enrichment score heatmap; (b) box diagram of difference in immune infiltration of TRP subtypes.
Figure 5
Figure 5
LASSO result diagram of TCGA training set. (a) The changing track of the LASSO regressed independent variable, the abscissa representing the logarithm of the independent variable lambda, and the ordinate representing the coefficient of the independent variable; (b) the confidence interval under each Lambda of LASSO; (c) LASSO regression coefficient of the key prognostic gene.
Figure 6
Figure 6
The verified prognostic efficacy of the model in the TCGA training set. (a) KM curve of TCGA training set; (b) ROC curve; (c)–(e): risk triple plot, including risk dispersion plot, survival time scatter plot, and heat map of model gene expression in RS grouping. Red represents the high-risk group and blue represents the low-risk group.
Figure 7
Figure 7
TCGA validation set and whole set validation model prognostic efficacy. (a)-(b): KM curve and ROC curve of TCGA verification set; (c)–(e): risk triple connection diagram of TCGA verification set; (f)-(g): KM curve and ROC curve of TCGA overall set; (h)–(j): risk triple connection diagram of TCGA overall set.
Figure 8
Figure 8
The GEO dataset was used for the verification of the model's prognostic efficacy. (a)-(b): KM curve and ROC curve of verification set GSE72094; (c)-(e): risk triple connection diagram of verification set GSE72094; (f)-(g): KM curve and ROC curve of verification set GSE68465; (h)-(j): risk triple connection diagram of verification set GSE68465.
Figure 9
Figure 9
Clinical characteristics were related to TRPRS. (a)-(f): the distribution of RS in the clinical feature group. The corresponding clinical features were gender, age, smoking history, EML4 rearrangement, EGFR mutation status, and clinical grade, respectively. (g) Single- and multi-factor cox forest map.
Figure 10
Figure 10
The model groups had a different proportion of immune infiltrating cells. (a)-(d): box diagram of the immune score, matrix score, tumor purity, and ESTIMATE score of high- and low-risk groups, respectively. Red represents the high-risk group and blue was for the low-risk group; (e) box plot of the proportion of immune infiltrating cells in high-risk and low-risk groups. Red indicates the high-risk group, and blue indicates the low-risk group.
Figure 11
Figure 11
The expression of immune checkpoints varied between model groups. (a)-(h): box diagram indicating the expression difference of immune checkpoints PDCD1, CD274, CTLA4, IL1A, IL1B, IDO1, CXCL8, and IL18 in high- and low-risk groups, respectively, in which red represents the high-risk group and blue represents the low-risk group.
Figure 12
Figure 12
Genomic mutation variations between model groups. (a) RS and TMB correlation scatter plot, R was the correlation coefficient, P was the significant P-value of the statistical test; (b) box diagram of TMB value of high- and low-risk groups; (c) SNV waterfall of top 30 (mutation frequency) genes in the LUAD cohort.
Figure 13
Figure 13
Variations in HALLMARKER pathway enrichment scores between model groups.
Figure 14
Figure 14
Variations in drug sensitivity between model groups. (a)-(f): IC50 box diagram of the first six drugs with the most significant difference in drug sensitivity in the high-risk and low-risk groups, respectively, in which red indicates the high-risk group and blue indicates the low-risk group.
Figure 15
Figure 15
TRPRS predicted immunotherapy effect. (a) KM curve of immunotherapy cohort; (b) box diagram of RS distribution in different immunotherapy response groups; (c) bar chart of proportion distribution of immunotherapy response of samples in high-risk and low-risk groups. Blue indicates the reactive group and red indicates the nonreactive group.

Similar articles

Cited by

References

    1. Travis W. D., Brambilla E., Riely G. J. New pathologic classification of lung cancer: relevance for clinical practice and clinical trials. Journal of Clinical Oncology . 2013;31(8):992–1001. doi: 10.1200/jco.2012.46.9270. - DOI - PubMed
    1. Sung H., Ferlay J., Siegel R. L., et al. Global cancer statistics 2020: GLOBOCAN estimates of incidence and mortality worldwide for 36 cancers in 185 countries. CA: A Cancer Journal for Clinicians . 2021;71(3):209–249. doi: 10.3322/caac.21660. - DOI - PubMed
    1. Sasatani Y., Okauchi S., Ohara G., Kagohashi K., Satoh H. Prolonged response after the discontinuation of nivolumab after resistance to gefitinib. Clin Respir J . 2019;13(10):657–658. doi: 10.1111/crj.13065. - DOI - PubMed
    1. Nakasuka T., Ichihara E., Makimoto G., Maeda Y., Kiura K. Primary resistance to alectinib was lost after bevacizumab combined chemotherapy in ALK-rearranged lung adenocarcinoma. Journal of Thoracic Oncology . 2019;14(8):e168–e169. doi: 10.1016/j.jtho.2019.03.009. - DOI - PubMed
    1. Zhang X., Hu M., Yang Y., Xu H. Organellar TRP channels. Nature Structural & Molecular Biology . 2018;25(11):1009–1018. doi: 10.1038/s41594-018-0148-z. - DOI - PMC - PubMed