. 2022 Aug 24:13:970285.
doi: 10.3389/fimmu.2022.970285. eCollection 2022.

Inactivated tick-borne encephalitis vaccine elicits several overlapping waves of T cell response

Affiliations

Inactivated tick-borne encephalitis vaccine elicits several overlapping waves of T cell response

Anastasiia L Sycheva et al. Front Immunol. .

Abstract

The development and implementation of vaccines have been growing exponentially, remaining one of the major successes of healthcare over the last century. Nowadays, active regular immunizations prevent epidemics of many viral diseases, including tick-borne encephalitis (TBE). Along with the generation of virus-specific antibodies, a highly effective vaccine should induce T cell responses providing long-term immune defense. In this study, we performed longitudinal high-throughput T cell receptor (TCR) sequencing to characterize changes in individual T cell repertoires of 11 donors immunized with an inactivated TBE vaccine. After two-step immunization, we found significant clonal expansion of both CD4+ and CD8+ T cells, ranging from 302 to 1706 vaccine-associated TCRβ clonotypes in different donors. We detected several waves of T cell clonal expansion generated by distinct groups of vaccine-responding clones. Both CD4+ and CD8+ vaccine-responding T cell clones formed 17 motifs in TCRβ sequences shared by donors with identical HLA alleles. Our results indicate that TBE vaccination leads to a robust T cell response due to the production of a variety of T cell clones with a memory phenotype, which recognize a large set of epitopes.

Keywords: T cell immune response; TBE vaccination; TCR motif; TCR repertoire; clonal expansion; immunological memory; tick-borne encephalitis.


Conflict of interest statement

The authors declare that the research was conducted in the absence of any commercial or financial relationships that could be construed as a potential conflict of interest.

Figures

Figure 1
Figure 1
Study design. (A) Timeline of vaccination and blood sample collection. At each time point two replicates of bulk PBMCs were collected (PBMCs 2x). Additional aliquots of PBMCs were divided into cell subsets, including CD4+, CD8+, and CD45RO+ (memory T cells). On days 37 and 44 a portion of PBMCs was used for in vitro stimulation with inactivated purified TBEV particles followed by isolation of CD137+ and IFNγ-producing T cells. Blood serum was used for TBEV-specific IgG antibody level measurement. (B) Donors cohort information.
Figure 2
Figure 2
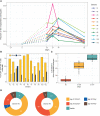
Characteristics of T cell immune response to two-step immunization with the inactivated TBE vaccine. (A) Dynamics of responded clonotype fractions in the bulk TCRβ repertoire calculated as the sum of clonotype frequencies (average of two replicates at each time point). (B) Percentage of CD4+ and CD8+ T cells from the fraction of responded T cells at the peak of expansion. The bar width corresponds to the CD4+ or CD8+ T cell clones. (C) Cumulative percentage of responded clonotypes found in TCRβ repertoires of memory (CD45RO+) T cell subsets among the responded clonotypes. (D) Vaccine-associated clonotypes found in TCRβ repertoires of CD137+ and IFNγ-producing T cells obtained after in vitro stimulation with inactivated purified TBEV particles on days 37 and 44 for donors #5 and #6. The numbers of detected clonotypes are indicated. For more details about the detection of “double” clonotypes in the activated T cell subsets see Supplementary Figure 5 .
Figure 3
Figure 3
Groups of vaccine-associated clonotypes with different dynamics. (A) Dynamics of the responded clonotype fractions in the bulk TCRβ repertoire ( Figure 2A ) formed by clonotypes of groups “d30”, “d37”, “d44”, and “d30_44”. (B) Fractions of clonotype groups in memory T cells on days 30 and 75. Donors #10 and #11 were excluded from analysis because of incomplete sample collection.
Figure 4
Figure 4
Vaccine-associated clonotypes with similar TCRβ amino acid sequences. (A, B) Pairs of similar TCRβ amino acid sequences (identical V and J segments and CDR3 length, with one or no mismatches in CDR3 amino acid sequences) for the responded and random clonotypes within a donor (A) and between two donors (B) normalized by the number of possible pairs in each subset. Paired two-tailed Wilcoxon signed-rank test was used (***p < 0.001, ****p < 0.0001). (C) Group distribution in the clusters of responded clonotypes with similar TCRβ amino acid sequences (example for donor #1). Only 2 of 12 clusters consist of clonotypes of the same group. (D) Sequence similarity network for the responded clonotypes of donor #1. Each vertex corresponds to a unique TCRβ clonotype, and edges connect clonotypes with one or no mismatches in CDR3 amino acid sequences and identical V and J segments. Only clusters with 4 or more clonotypes are shown. The color scheme is the same as in (C).
Figure 5
Figure 5
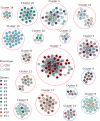
Sequence similarity networks for the responded clonotypes from different donors. Each vertex corresponds to a unique TCRβ clonotype. Edges connect clonotypes with one or no mismatches in CDR3 amino acid sequences and identical V and J segments; only edges between clonotypes of different donors are shown. Color of the area around clusters indicates CD4+ (red) or CD8+ (blue) phenotypes of T cell clones in the cluster. Only clonotypes with similarity to at least 2 clonotypes of other donors and clusters with 6 or more clonotypes are displayed.
Figure 6
Figure 6
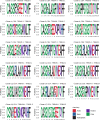
CDR3 amino acids motifs of clustered clonotypes from different donors. CDR3 amino acid sequences of the responded clonotypes from the indicated clusters are presented as sequence logos. Cluster numbers (as in Figure 5 ), phenotypes (CD4+ or CD8+), and V-J segments of T cell clones are shown on the top of the logos. Amino acids are colored according to their chemical properties.

References

    1. Rappuoli R, Pizza M, Del Giudice G, De Gregorio E. Vaccines, new opportunities for a new society. Proc Natl Acad Sci U.S.A. (2014) 111:12288–93. doi: 10.1073/pnas.1402981111 - DOI - PMC - PubMed
    1. Plotkin Stanley A. Correlates of protection induced by vaccination. Clin Vaccine Immunol (2010) 17:1055–65. doi: 10.1128/CVI.00131-10 - DOI - PMC - PubMed
    1. Sullivan JL, Mayner RE, Barry DW, Ennis FA. Influenza virus infection in nude mice. J Infect Dis (1976) 133:91–4. doi: 10.1093/infdis/133.1.91 - DOI - PubMed
    1. Bortnick A, Allman D. What is and what should always have been: long-lived plasma cells induced by T cell-independent antigens. J Immunol (2013) 190:5913–8. doi: 10.4049/jimmunol.1300161 - DOI - PMC - PubMed
    1. Choi KH. Viral polymerases. In: Rossmann MG, Rao VB, editors. Viral molecular machines. Boston: MA: Springer US; (2012). p. 267–304. doi: 10.1007/978-1-4614-0980-9_12 - DOI

Publication types