. 2022 Aug 24:13:944591.
doi: 10.3389/fimmu.2022.944591. eCollection 2022.

Multi-omics analysis reveals the metabolic regulators of duodenal low-grade inflammation in a functional dyspepsia model

Affiliations

Multi-omics analysis reveals the metabolic regulators of duodenal low-grade inflammation in a functional dyspepsia model

Shuai Ji et al. Front Immunol. .

Abstract

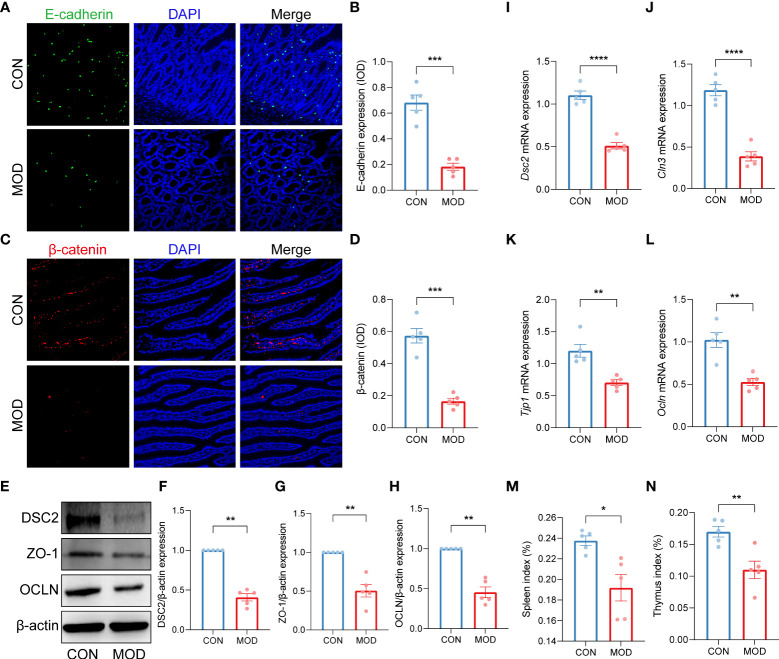
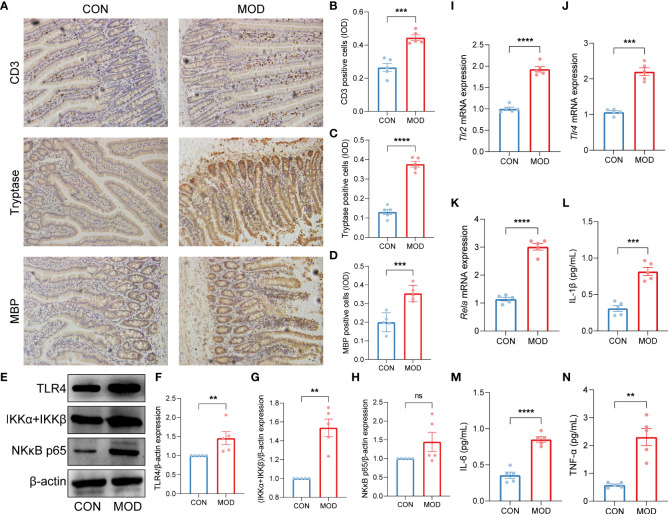
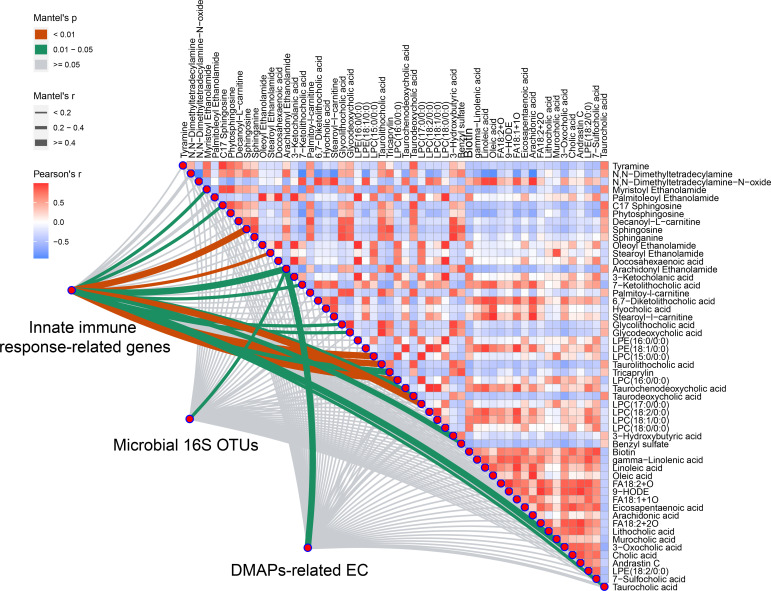
Several gastrointestinal phenotypes and impairment of duodenal mucosal barrier have been reported in clinical studies in patients with functional dyspepsia (FD). Due to the preferential colonization of the mucosa, intestinal microbes and their metabolites are commonly involved in host metabolism and immune responses. However, there are no studies on the intertwined correlation among multi-level data. For more comprehensive illustrating, a multi-omics analysis focusing on the duodenum was performed in the FD rat model. We found that differential microbiomes in the duodenum were significantly correlated with the biosynthesis of lipopolysaccharide and peptidoglycan. The innate immune response-related genes, which were upregulated in the duodenum, were associated with the TLR2/TLR4-NFκB signaling pathway. More importantly, arachidonyl ethanolamide (anandamide, AEA) and endocannabinoid analogues showed linear relationships with the FD phenotypes. Taken together, multi-level data from microbiome, transcriptome and metabolome reveal that AEA may regulate duodenal low-grade inflammation in FD. These results suggest an important cue of gut microbiome-endocannabinoid system axis in the pathogenesis of FD.

Keywords: endocannabinoid; functional dyspepsia; inflammation; innate immune; multi-omics.


Conflict of interest statement

The authors declare that the research was conducted in the absence of any commercial or financial relationships that could be construed as a potential conflict of interest.

Figures

Figure 1
Figure 1
Phenotypes found in the rat model of FD. (A) A schematic diagram of the multi-omics analysis. (B) Changes in body weights (*** p < 0.001 by two-way ANOVA with correction of two-stage linear step-up procedure of Benjamini, Krieger and Yekutieli, ns indicates not significant). (C) Gastrointestinal transit rate. (D) H&E-stained duodenum. Scale bar, 20 μm. (E) TEM analysis of duodenum. Scale bar, 500 nm. Two red triangles indicate incomplete tight junctions. (F) Behavioral testing of GD (10 to 60 mmHg) and pain score (0-4). (G) TEER of duodenal epithelial barrier (**** p < 0.0001 by unpaired t test with Welch’s correction). (H) Urine L/M ratio (** p < 0.01 by Mann Whitney test). (I) Plasma content of D-lactate (**** p < 0.0001 by unpaired t test with Welch’s correction). The circles on the bar plots represent individual values with mean ± SEM (bars) (n = 3 or 5 rats/group).
Figure 2
Figure 2
Impaired duodenal mucosal barrier was accompanied with decreased immune organs index. (A-D) Duodenal immunofluorescence staining (A, C) and the relative expression (IOD) of E-cadherin (B) and β-catenin (D) (*** p < 0.001 by unpaired t test with Welch’s correction). (E-H) The WB bands (E) and scaled normalized protein expressions of DSC2 (F), ZO-1 (G) and OCLN (H) (** p < 0.01 by Mann Whitney test). (I-L) The relative mRNA expression of Dsc2 (I), Cln3 (J), Tjp1 (K) and Ocln (L) (** p < 0.01, **** p < 0.0001 by unpaired t test with Welch’s correction). (M, N) Indexes of spleen (M) and thymus (N) (* p < 0.05, ** p < 0.01 by unpaired t test with Welch’s correction). The circles on the bar plots represent individual values with mean ± SEM (bars) (n = 5 rats/group).
Figure 3
Figure 3
Microbial features of duodenum. (A) Weighted UniFrac PCoA with an adonis test. (B) Differential microbiome with DESeq2 analysis. The left dots (blue) indicate the microbiome enriched in control group; the right dots (red) are representative of the microbiome enriched in model group. (C) Spearman correlations of differential microbiome and predicted functional enzymes (Spearman’s r > 0.6 with + FDR < 0.05, ++ FDR < 0.01 or +++ FDR < 0.001 represent significant). The right side indicates multiple comparison of relative abundance of enzymes with Fisher’s LSD (mean ± SEM, * p < 0.05 represent significant) (n = 5 rats/group).
Figure 4
Figure 4
Transcriptome analysis of duodenum. (A) Differential expressed genes with DESeq2 analysis. Dotted line: BH FDR < 0.05 and |log2(FC)| > 1 represent significant (the control group: high expression in blue; the model group: high expression in red). (B) Selected differential genes based on InnateDB database. (C) PPI network based on innate immune response-related protein-coding genes (interaction score > 0.7 and hiding disconnected nodes). (D) The subnetwork clustering with MCL algorithm. Color-coded dots were clustered with GO and KEGG pathway enrichment analysis (n = 5 rats/group).
Figure 5
Figure 5
Validation of innate immune cells-mediated TLR2/TLR4-NFκB signaling pathway. (A-D) Duodenal immunohistochemical staining (A) and the relative expression (IOD) of CD3-labeled T lymphocytes (B), tryptase-labeled mast cells (C) and MBP-labeled eosinophils (D) (*** p < 0.001, **** p < 0.0001 by unpaired t test with Welch’s correction). (E-H) The WB bands (E) and scaled normalized protein expressions of TLR4 (F), IKKα + IKKβ (G) and NK-κB p65 (H) (** p < 0.01 by Mann Whitney test, ns indicates not significant). (I-K) The relative mRNA expressions of Tlr2 (I), Tlr4 (J) and Rela (K) (*** p < 0.001, **** p < 0.0001 by unpaired t test with Welch’s correction). (L-N) The plasma contents of proinflammatory cytokines IL-1β (L), IL-6 (M) and TNF-α (N) (IL-1β and IL-6: *** p < 0.001, **** p < 0.0001 by unpaired t test with Welch’s correction; TNF-α: ** p < 0.01 by Mann Whitney test) (n = 5 rats/group).
Figure 6
Figure 6
Metabolome analysis of duodenum. Differential metabolites were identified with thresholds of p < 0.05, |log2(FC)| > 1, |p(corr)| > 0.5 and VIP > 1 with cvSE of VIP less than the VIP value (n = 5 rats/group). The compound names corresponding to the Metabo_ID from top to bottom are as follows. 60311: Glycolithocholic acid; 72690: Taurolithocholate; 24353: Decanoyl-L-carnitine; 25117: Sphingosine; 64527: Glycodeoxycholic acid; 36182: Arachidonyl Ethanolamide; 374: Tyramine; 20850: C17 Sphingosine; 29548: Taurocholic acid; 885: Benzyl sulfate; 12399: Myristoyl Ethanolamide; 25708: Sphinganine; 8: 3-Hydroxybutyric acid; 76412: Taurodeoxycholate; 50488: Palmitoylcarnitine; 74720: Tricaprylin; 24088: Phytosphingosine; 7272: N,N-Dimethyltetradecylamine; 26133: 7-Sulfocholic acid; 5350: FA 18:2+O; 5970: Eicosapentaenoic acid; 5467: 9-HODE; 3964: gamma-Linolenic acid; 4125: Linoleic acid; 16342: Cholic acid; 7230: FA 18:2+2O; 24757: LPE(18:2/0:0); 47714: 7-Ketolithocholic acid; 12818: Lithocholic acid; 22300: Andrastin C; 6227: Arachidonic acid; 2256: Biotin; 51910: 6,7-Diketolithocholic acid; 16085: 3-Oxocholic acid; 14471: Murocholic acid; 76396: Taurochenodeoxycholate; 5608: FA 18:1+1O; 82138: LPC(18:1/0:0); 4333: Oleic acid; 71469: LPE(18:1/0:0); 42374: 3-Ketocholanic Acid; 26167: Oleoyl Ethanolamide; 53148: Hyocholic acid; 9518: N,N-Dimethyltetradecylamine-N-oxide; 58556: Stearoyl-L-Carnitine; 79133: LPC(17:0/0:0); 18195: Palmitoleoyl Ethanolamide; 75519: LPC(16:0/0:0); 72242: LPC(15:0/0:0); 27125: Docosahexaenoic acid; 26872: Stearoyl Ethanolamide; 65396: LPE(16:0/0:0); 82721: LPC(18:0/0:0); 81681: LPC(18:2/0:0).
Figure 7
Figure 7
Variations of microbiome with DAMPs-related enzymes and duodenal metabolites have significant relationship with innate immune response-related genes expression. Integrated analysis of multi-omics data was performed using Mantel test. AEA was selected from all the three profiles (Mantel’s p < 0.05 represent significant) (n = 5 rats/group).
Figure 8
Figure 8
Linear regression analysis of AEA and features of FD. (A) Gastrointestinal motor function. AEA was negatively linear correlated with the gastrointestinal transit rate. (B-D) Duodenal permeability and absorption. AEA was positively linear correlated with L/M ratio (B) and the content of D-lactate (C), while negatively linear correlated with TEER (D). (E-I) Duodenal mucosal barrier. AEA was negatively linear corelated with the relative protein expressions of E-cadherin (E) and β-catenin (F) and the relative mRNA expressions of Dsc2 (G), Ocln (H) and Cln3 (I). (J-P) Innate immune cells and proinflammatory signaling. AEA was positively linear correlated with the relative amounts of mast cells (J), the relative mRNA expressions of Tlr2 (K), Tlr4 (L) and Rela (M), and the contents of proinflammatory cytokines IL-1β (N), IL-6 (O) and TNF-α (P) (All data are log10 transformed. p < 0.05 represent significant) (n = 5 rats/group).

Similar articles

Cited by

References

    1. Ford AC, Mahadeva S, Carbone MF, Lacy BE, Talley NJ. Functional dyspepsia. Lancet (2020) 396(10263):1689–702. doi: 10.1016/S0140-6736(20)30469-4 - DOI - PubMed
    1. Black CJ, Drossman DA, Talley NJ, Ruddy J, Ford AC. Functional gastrointestinal disorders: advances in understanding and management. Lancet (2020) 396(10263):1664–74. doi: 10.1016/S0140-6736(20)32115-2 - DOI - PubMed
    1. Cordner ZA, Li Q, Liu L, Tamashiro KL, Bhargava A, Moran TH, et al. . Vagal gut-brain signaling mediates amygdaloid plasticity, affect, and pain in a functional dyspepsia model. JCI Insight (2021) 6(6):e144046. doi: 10.1172/jci.insight.144046 - DOI - PMC - PubMed
    1. Nojkov B, Zhou S-Y, Dolan RD, Davis EM, Appelman HD, Guo X, et al. . Evidence of duodenal epithelial barrier impairment and increased pyroptosis in patients with functional dyspepsia on confocal laser endomicroscopy and "Ex vivo" mucosa analysis. Am J Gastroenterol (2020) 115(11):1891–901. doi: 10.14309/ajg.0000000000000827 - DOI - PMC - PubMed
    1. Cani PD, Plovier H, Van Hul M, Geurts L, Delzenne NM, Druart C, et al. . Endocannabinoids–at the crossroads between the gut microbiota and host metabolism. Nat Rev Endocrinol (2016) 12(3):133–43. doi: 10.1038/nrendo.2015.211 - DOI - PubMed

Publication types

Substances