

Variable frequencies of peripheral T-lymphocyte subsets in the diabetes spectrum from type 1 diabetes through latent autoimmune diabetes in adults (LADA) to type 2 diabetes
- PMID: 36091068
- PMCID: PMC9449581
- DOI: 10.3389/fimmu.2022.974864
Variable frequencies of peripheral T-lymphocyte subsets in the diabetes spectrum from type 1 diabetes through latent autoimmune diabetes in adults (LADA) to type 2 diabetes
Abstract
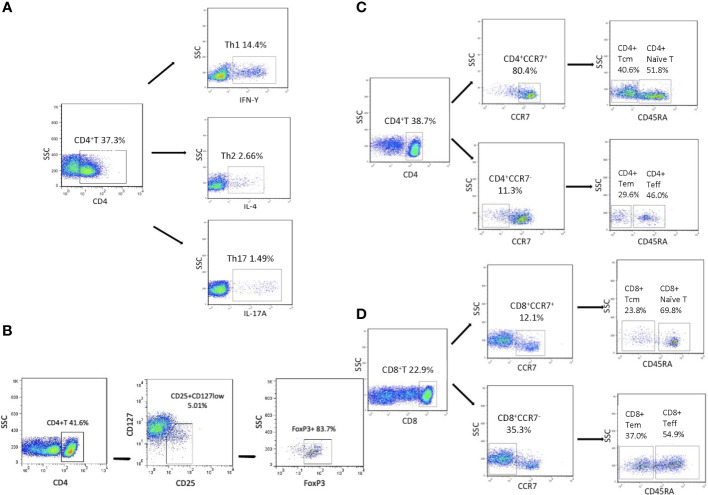
T lymphocytes are key players in the pathogenesis of autoimmune diabetes. We recruited subjects with T1D (n=81), LADA (n=82), T2D (n=95) and NGT (n=218) and analyzed the percentages of T-lymphocyte subsets, including T helper 1 (Th1), T helper 2 (Th2), T helper 17 (Th17), T cytotoxic 1 (Tc1), regulatory T cells (Tregs), effector T (Teff), naïve T, central memory T (Tcm), and effector memory T (Tem) cells by flow cytometry. LADA patients possessed similar frequencies of IFN-γ+CD4+ T (Th1), IFN-γ+CD8+ T and CD4+ Teff cells compared with T1D patients, but much lower than those of NGT subjects. Like T2D patients, LADA patients had increased frequencies of CD4+ Tem and CD8+ Tem cells with respect to T1D and NGT subjects. In LADA patients, Th2 cells were decreased while CD4+ Tcm cells were increased compared with NGT subjects. Notably, we observed significant negative correlations between the CD4+ Tcm cell frequency and C-peptide in LADA subjects. These data demonstrates that LADA patients possess T-cell subset changes resembling both T1D and T2D and represent the middle of the diabetes spectrum between T1D and T2D. Based on these T-cell subset alterations, we speculate that autoimmunity-induced β-cell destruction and inflammation-induced insulin resistance might both be involved in the pathogenesis of LADA.
Keywords: CD4+ Tcm cells; LADA; T-lymphocytes; T1D; T2D; Th1 cells.
Copyright © 2022 Tan, Xiang, Deng, Cao, Ren, Huang and Zhou.
Conflict of interest statement
The authors declare that the research was conducted in the absence of any commercial or financial relationships that could be construed as a potential conflict of interest.
Figures


Similar articles
-
Altered Peripheral B-Lymphocyte Subsets in Type 1 Diabetes and Latent Autoimmune Diabetes in Adults.Diabetes Care. 2016 Mar;39(3):434-40. doi: 10.2337/dc15-1765. Epub 2015 Dec 30. Diabetes Care. 2016. PMID: 26721817 Free PMC article.
-
Altered regulatory T cell phenotype in latent autoimmune diabetes of the adults (LADA).Clin Exp Immunol. 2016 Oct;186(1):46-56. doi: 10.1111/cei.12834. Epub 2016 Aug 24. Clin Exp Immunol. 2016. PMID: 27357431 Free PMC article.
-
The continuous spectrum of glycaemic variability changes with pancreatic islet function: A multicentre cross-sectional study in China.Diabetes Metab Res Rev. 2022 Nov;38(8):e3579. doi: 10.1002/dmrr.3579. Epub 2022 Oct 25. Diabetes Metab Res Rev. 2022. PMID: 36214297
-
New Insights into the Genetics of Latent Autoimmune Diabetes in Adults.Curr Diab Rep. 2020 Jul 28;20(9):43. doi: 10.1007/s11892-020-01330-y. Curr Diab Rep. 2020. PMID: 32725517 Review.
-
Latent Autoimmune Diabetes in Adults (LADA): From Immunopathogenesis to Immunotherapy.Front Endocrinol (Lausanne). 2022 Jul 21;13:917169. doi: 10.3389/fendo.2022.917169. eCollection 2022. Front Endocrinol (Lausanne). 2022. PMID: 35937817 Free PMC article. Review.
Cited by
-
Prognosis and outcome of latent autoimmune diabetes in adults: T1DM or T2DM?Diabetol Metab Syndr. 2024 Oct 7;16(1):242. doi: 10.1186/s13098-024-01479-6. Diabetol Metab Syndr. 2024. PMID: 39375804 Free PMC article. Review.
-
A novel subpopulation of monocytes with a strong interferon signature indicated by SIGLEC-1 is present in patients with in recent-onset type 1 diabetes.Diabetologia. 2024 Apr;67(4):623-640. doi: 10.1007/s00125-024-06098-4. Epub 2024 Feb 13. Diabetologia. 2024. PMID: 38349399
-
Association of RPS26 gene polymorphism with different types of diabetes in Chinese individuals.J Diabetes Investig. 2024 Jan;15(1):34-43. doi: 10.1111/jdi.14117. Epub 2023 Dec 2. J Diabetes Investig. 2024. PMID: 38041572 Free PMC article.
-
The crucial role and mechanism of insulin resistance in metabolic disease.Front Endocrinol (Lausanne). 2023 Mar 28;14:1149239. doi: 10.3389/fendo.2023.1149239. eCollection 2023. Front Endocrinol (Lausanne). 2023. PMID: 37056675 Free PMC article.
-
Association between a high triglyceride-glucose index and chronic kidney disease in adult patients with latent autoimmune diabetes.BMC Endocr Disord. 2023 Sep 28;23(1):209. doi: 10.1186/s12902-023-01465-5. BMC Endocr Disord. 2023. PMID: 37770895 Free PMC article.
References
-
- Zhou Z, Xiang Y, Ji L, Jia W, Ning G, Huang G, et al. . Frequency, immunogenetics, and clinical characteristics of latent autoimmune diabetes in China (LADA China study): a nationwide, multicenter, clinic-based cross-sectional study. Diabetes (2013) 62(2):543–50. doi: 10.2337/db12-0207 - DOI - PMC - PubMed
Publication types
MeSH terms
LinkOut - more resources
Full Text Sources
Medical
Research Materials