. 2022 Aug 24:12:979748.
doi: 10.3389/fonc.2022.979748. eCollection 2022.

Characterization of ex vivo and in vivo intraoperative neurosurgical confocal laser endomicroscopy imaging

Affiliations

Characterization of ex vivo and in vivo intraoperative neurosurgical confocal laser endomicroscopy imaging

Yuan Xu et al. Front Oncol. .

Abstract

Background: The new US Food and Drug Administration-cleared fluorescein sodium (FNa)-based confocal laser endomicroscopy (CLE) imaging system allows for intraoperative on-the-fly cellular level imaging. Two feasibility studies have been completed with intraoperative use of this CLE system in ex vivo and in vivo modalities. This study quantitatively compares the image quality and diagnostic performance of ex vivo and in vivo CLE imaging.

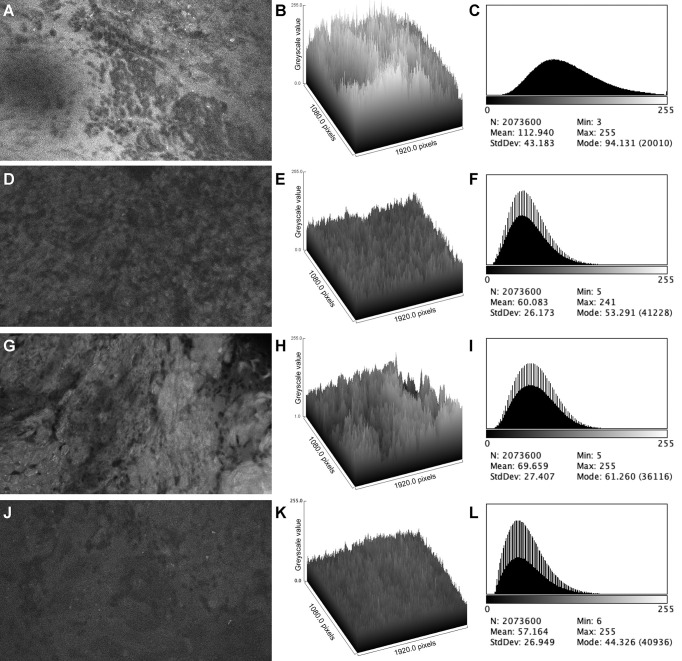
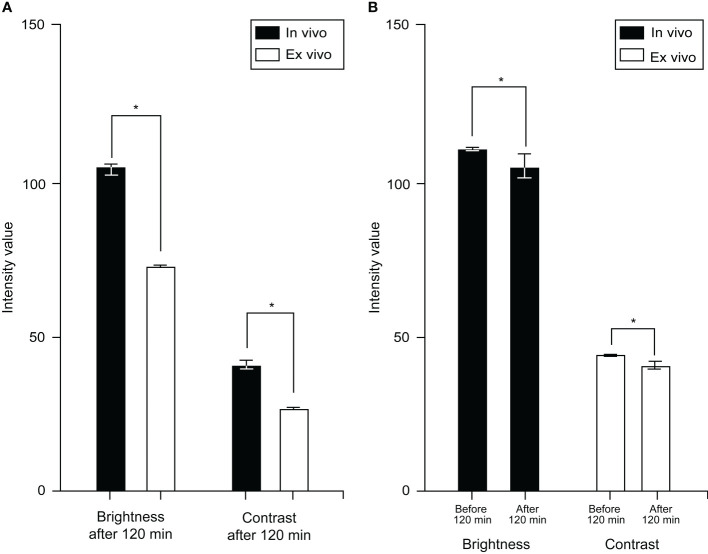
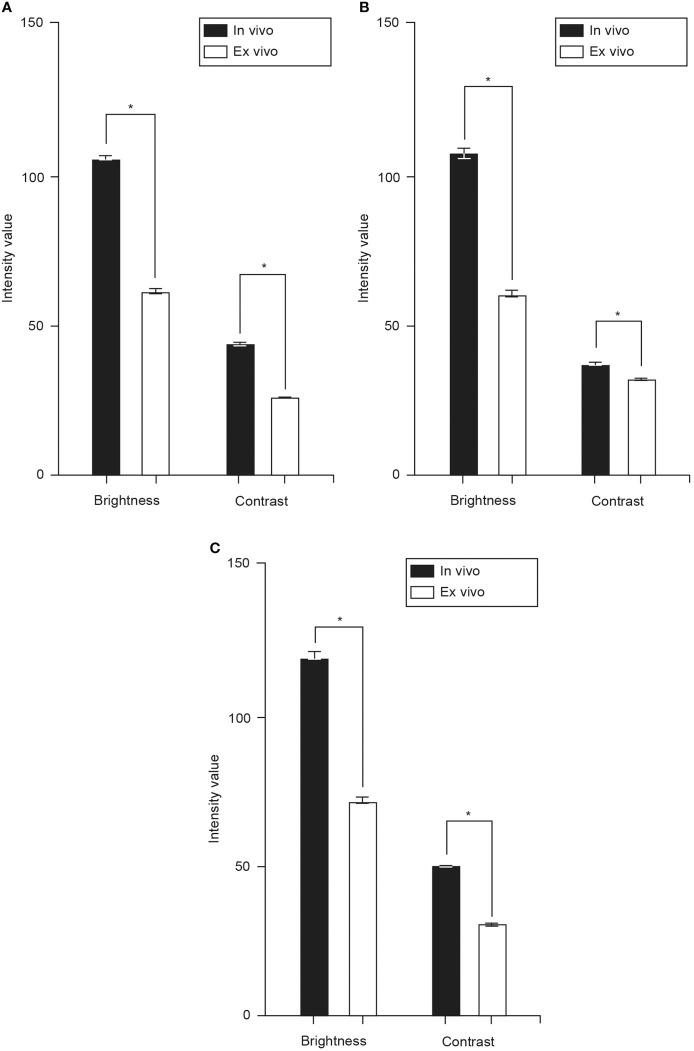
Methods: Images acquired from two prospective CLE clinical studies, one ex vivo and one in vivo, were analyzed quantitatively. Two image quality parameters - brightness and contrast - were measured using Fiji software and compared between ex vivo and in vivo images for imaging timing from FNa dose and in glioma, meningioma, and intracranial metastatic tumor cases. The diagnostic performance of the two studies was compared.

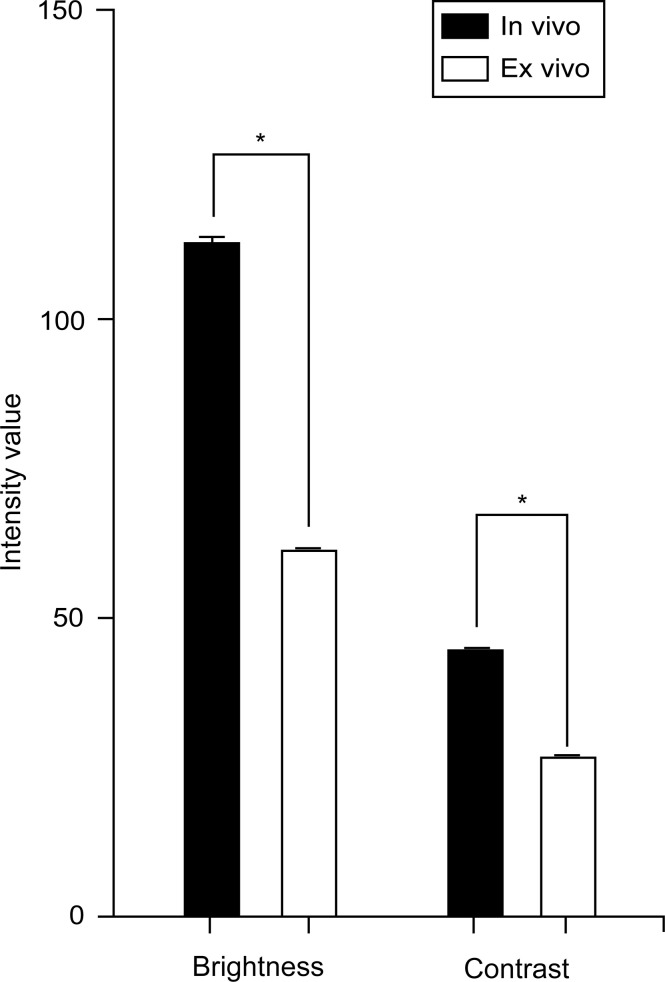
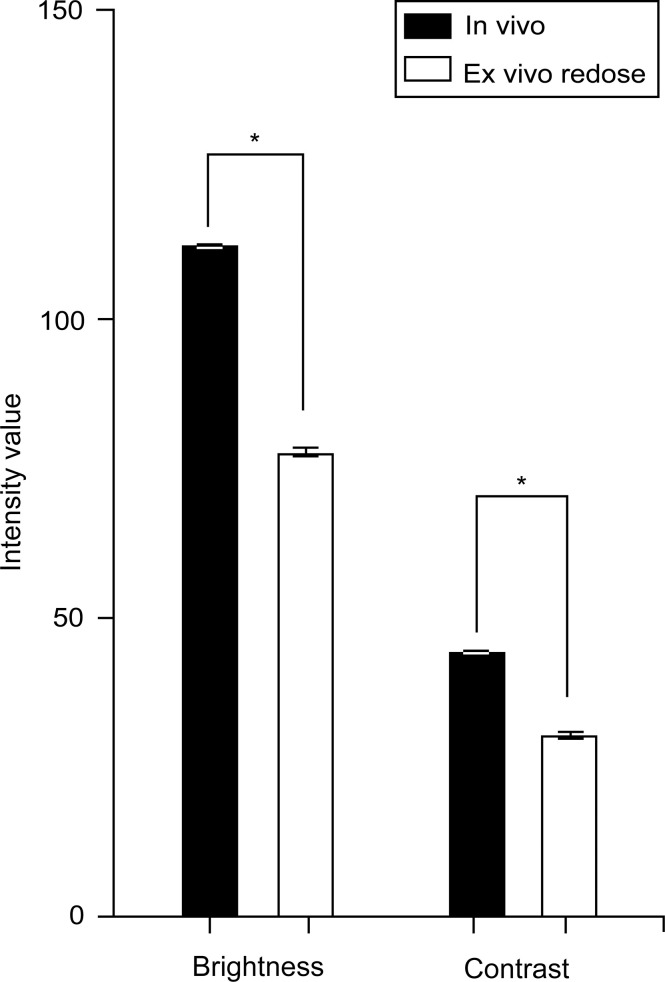
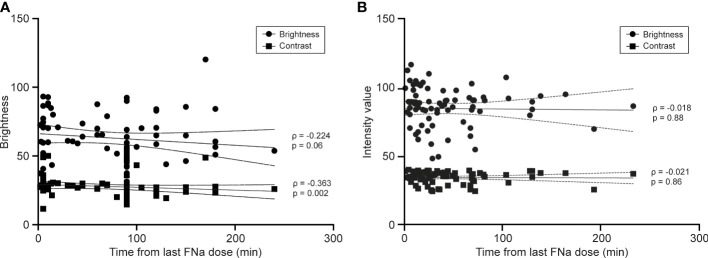
Results: Overall, the in vivo images have higher brightness and contrast than the ex vivo images (p < 0.001). A weak negative correlation exists between image quality and timing of imaging after FNa dose for the ex vivo images, but not the in vivo images. In vivo images have higher image quality than ex vivo images (p < 0.001) in glioma, meningioma, and intracranial metastatic tumor cases. In vivo imaging yielded higher sensitivity and negative predictive value than ex vivo imaging.

Conclusions: In our setting, in vivo CLE optical biopsy outperforms ex vivo CLE by producing higher quality images and less image deterioration, leading to better diagnostic performance. These results support the in vivo modality as the modality of choice for intraoperative CLE imaging.

Keywords: brain tumor; confocal laser endomicroscopy; fluorescein sodium; fluorescence; glioma; intraoperative imaging; meningioma.


Conflict of interest statement

The authors declare that the research was conducted in the absence of any commercial or financial relationships that could be construed as a potential conflict of interest.

Figures

Figure 1
Figure 1
Bar chart showing a comparison of overall mean (SD) brightness and contrast of in vivo and ex vivo images. In vivo images had a mean brightness of 112.1 (26.9) and contrast of 44.7 (8.0). Ex vivo images had a mean brightness of 60.7 (23.6) and a contrast of 26.8 (7.9). In vivo images have higher brightness and contrast than ex vivo images (p < 0.001). Values are reported in optical density units defined by the Fiji software. Asterisk indicates p < 0.001. Used with permission from Barrow Neurological Institute, Phoenix, Arizona.
Figure 2
Figure 2
Examples of confocal laser endomicroscopy images and data from in vivo and ex vivo studies. In vivo image and data (A–C) show a brighter background and more perceivable cellular structure than the corresponding ex vivo image and data (D–F). Ex vivo image and data from a patient who had an additional FNa dose (G–I) shows improved overall brightness and contrast compared to the image from the same patient before FNa redosing (J–L). Mean, brightness; StdDev, brightness; Min and Max, minimum and maximum gray value of pixels in the image; Mode, most frequent occurring gray value in the image. Values are reported in optical density units defined by Fiji software. Used with permission from Barrow Neurological Institute, Phoenix, Arizona.
Figure 3
Figure 3
Bar plot showing the brightness and contrast of ex vivo images from patients that were redosed with fluorescein sodium. The mean brightness (77.8 [19.9]) and contrast (30.9 [7.5]) are inferior to those from the in vivo study. Values are reported in optical density units defined by Fiji software. Asterisk indicates p < 0.001. Used with permission from Barrow Neurological Institute, Phoenix, Arizona.
Figure 4
Figure 4
Line graphs showing the correlation between image quality and image timing. (A) For the ex vivo study, there is a small negative correlation between image contrast and the time interval between fluorescein sodium dosing and imaging (ρ = -0.363, p = 0.002). The result for image brightness and timing of imaging was not statistically significant (ρ = -0.224, p = 0.06). (B) For the in vivo study, no correlation was observed between image brightness (ρ = -0.018, p = 0.88) and contrast (ρ = -0.021, p = 0.86) and timing of imaging. Used with permission from Barrow Neurological Institute, Phoenix, Arizona.
Figure 5
Figure 5
Bar chart showing mean (SD) brightness and contrast of images acquired at different time intervals after fluorescein sodium (FNa) dosing. (A) Comparison of images acquired later than 120 min after FNa dosing in both studies; the mean brightness (in vivo vs. ex vivo: 105.1 [18.9] vs. 72.4 [24.9], p < 0.001) and contrast (in vivo vs. ex vivo: 41.7 [8.7] vs. 27.1 [8.5], p < 0.001) of the in vivo images are significantly higher than those of the ex vivo images. (B) Compared to the images acquired earlier than 120 minutes after FNa dose, the images acquired later than 120 minutes had a slight decrease in brightness (112.2 [27.0] to 105.1 [18.9], p < 0.001) and contrast (44.74 [8.0] to 41.07 [8.6], p < 0.001). Values are reported in optical density units defined by Fiji software. Asterisk indicates p < 0.001. Used with permission from Barrow Neurological Institute, Phoenix, Arizona.
Figure 6
Figure 6
Bar charts showing mean brightness and contrast of images from glioma (A), meningioma (B), and intracranial metastatic tumor (C) cases from both studies. The mean brightness and contrast of the in vivo images from glioma (brightness: 105.2 [25.8] vs. 60.6 [8.1], p < 0.001; contrast: 43.2 [24.9] vs. 26.5 [6.9], p < 0.001), meningioma (brightness: 106.3 [26.0] vs. 60.0 [18.8], p < 0.001; contrast: 36.7 [8.0] vs. 31.7 [8.9], p < 0.001), and intracranial metastatic tumor (brightness: 118.2 [26.5] vs. 70.6 [25.1], p < 0.001; contrast: 49.6 [4.9] vs. 30.1 [6.8], p < 0.001, Figure 6C values are significantly higher than those of the ex vivo images. Values are reported in optical density units defined by Fiji software. Asterisk indicates p < 0.001. Used with permission from Barrow Neurological Institute, Phoenix, Arizona.
Figure 7
Figure 7
Correlation between confocal laser endomicroscopy (CLE) images and permanent hematoxylin and eosin (H&E)-stained sections. An in vivo CLE image from a patient with glioblastoma (A) showing hypercellularity and large atypical cells (arrowheads) similar to those in the H&E section (arrowheads) (B). Another ex vivo image from a different patient with glioblastoma (C) with hypercellularity and atypical cells (arrowheads) also found in the H&E section (arrowheads) (D). An in vivo image from a patient with meningioma (E) demonstrating the clear transition (dashed line) of a nest of tumor cells to acellular fibrous dura tissue, with an H&E section (F) showing tumor cell nests (arrowheads) within normal collagenous dura. Used with permission from Barrow Neurological Institute, Phoenix, Arizona.
Figure 8
Figure 8
An ex vivo meningioma image (A) showing refractile fibers and a whirling pattern corresponding to the H&E slide (B). An in vivo image from intracranial metastatic breast carcinoma (C) with nests of highly dense epithelioid cells. H&E slide of the same patient (D) showing tumor cell nests with hemorrhage. An ex vivo image (E) and H&E section (F) from a patient with choroid plexus carcinoma showing tumor cells along the basement membrane (arrows). Used with permission from Barrow Neurological Institute, Phoenix, Arizona.

References

    1. Jaafar H. Intra-operative frozen section consultation: concepts, applications and limitations. Malays J Med Sci (2006) 13(1):4–12. - PMC - PubMed
    1. Novis DA, Zarbo RJ. Interinstitutional comparison of frozen section turnaround time. A College of American Pathologists Q-Probes study of 32868 frozen sections in 700 hospitals. Arch Pathol Lab Med (1997) 121(6):559–67. - PubMed
    1. US Food and Drug Administration . US FDA Clearance for convivo. 510(k) Premarket Notification: CONVIVO. Available at: https://www.accessdata.fda.gov/scripts/cdrh/cfdocs/cfpmn/pmn.cfm?ID=K181116. K181116.
    1. Belykh E, Onaka NR, Zhao X, Abramov I, Eschbacher JM, Nakaji P, et al. . High-dose fluorescein reveals unusual confocal endomicroscope imaging of low-grade glioma. Front Neurol (2021) 12:668656. doi: 10.3389/fneur.2021.668656 - DOI - PMC - PubMed
    1. Zehri AH, Ramey W, Georges JF, Mooney MA, Martirosyan NL, Preul MC, et al. . Neurosurgical confocal endomicroscopy: A review of contrast agents, confocal systems, and future imaging modalities. Surg Neurol Int (2014) 5:60. doi: 10.4103/2152-7806.131638 - DOI - PMC - PubMed

LinkOut - more resources