. 2022 Aug 24:13:979121.
doi: 10.3389/fphys.2022.979121. eCollection 2022.

LncRNA-mRNA modules involved in goat rumen development: Insights from genome-wide transcriptome profiling

Affiliations

LncRNA-mRNA modules involved in goat rumen development: Insights from genome-wide transcriptome profiling

Tao Zhong et al. Front Physiol. .

Abstract

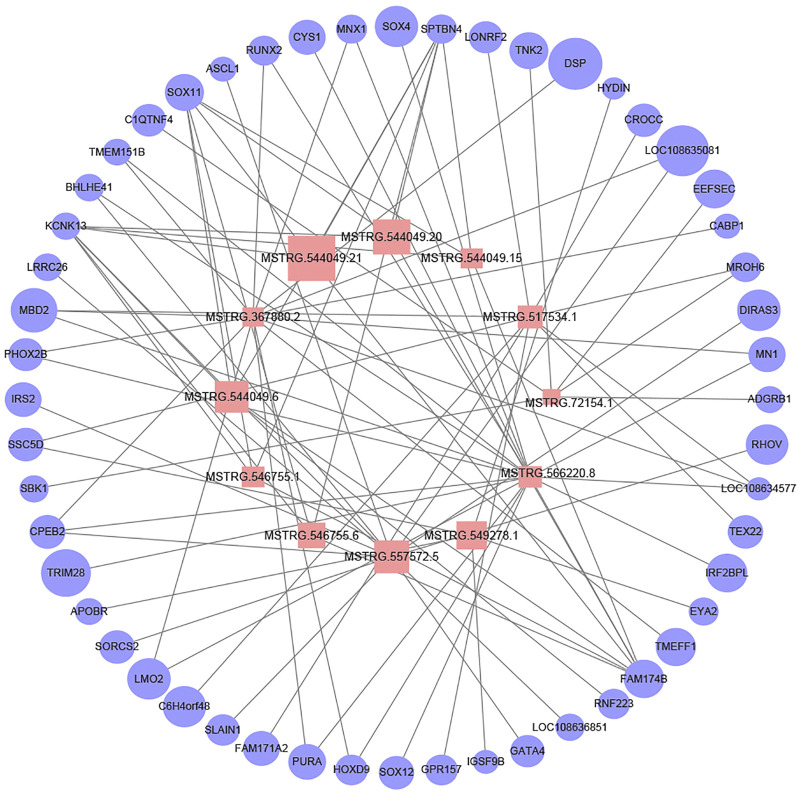
The rumen is an essential digestive and absorption organ of ruminants. During fetal life, lactation, and post-weaning period, goat rumen undergoes drastic morphological and metabolic-functional changes triggered by potential regulated genes and non-coding RNA molecules. As the essential regulatory factors, long non-coding RNAs (lncRNAs) have vital functions in various biological activities. However, their roles during rumen development are still poorly explored in ruminants. To explore the genome-wide expression profiles of lncRNAs and mRNAs in the goat rumens, we generated 5,007 lncRNAs and 19,738 mRNAs identified during the fetal and prepubertal stages by the high-throughput RNA sequencing. Notably, 365 lncRNAs and 2,877 mRNAs were considered to be differentially expressed. The weighted gene co-expression network analysis and functional analysis were performed to explore the regulatory roles of those differentially expressed molecules. The cis-and trans-target genes of differently expressed lncRNAs were enriched for pathways related to focal adhesion, cGMP-PKG signaling pathway, alpha-linolenic acid metabolism, arachidonic acid metabolism, and fat digestion and absorption. Gene Ontology and the Kyoto Encyclopedia of Genes and Genomes analyses showed that the differently expressed genes mainly participated in mitotic cytokinesis, desmosome, fatty acid degradation, cell adhesion molecules, and fatty acid metabolism. The prediction of lncRNA-mRNA interaction networks further revealed transcripts potentially involved in rumen development. The present study profiles a global overview of lncRNAs and mRNAs during rumen development. Our findings provide valuable resources for genetic regulation and molecular mechanisms of rumen development in ruminants.

Keywords: Goat; different expression; lncRNA; mRNA; pathway; rumen; transcriptome.


Conflict of interest statement

The authors declare that the research was conducted in the absence of any commercial or financial relationships that could be construed as a potential conflict of interest.

Figures

FIGURE 1
FIGURE 1
Morphometric analysis of goat stomach. Morphological determination of rumen (A), reticulum (B), omasum (C), and abomasum (D) in goats.
FIGURE 2
FIGURE 2
Properties of lncRNAs and mRNAs in goat rumen tissues. (A) Venn diagram of the lncRNAs either shared between or uniquely expressed in rumen tissues from different stages. (B) Prevalence of the different lncRNA types. (C) PCA of the lncRNAs. (D) PCA plot of the mRNAs. (E) Differentially expressed lncRNAs and mRNAs during goat rumen development. Red and green represent up-regulated and downregulated molecules, respectively. The expression level (F), length distribution (G), and exon number distribution (H) of lncRNAs and mRNAs. Red and green represent lncRNAs and mRNAs, respectively.
FIGURE 3
FIGURE 3
Dynamic expression of lncRNAs during goat rumen development. (A) Heatmap of the DELs during rumen development. (B) WGCNA co-expression network of the rumens. Modules of co-expressed genes were assigned a unique colour and number (M1-M11). (C–E) KEGG analysis of the DEGs in the M1 (C), M2 (D), and M5 (E) modules. Top 10 KEGG pathway enrichment terms. The horizontal axis represents a rich factor and the vertical axis represents the pathway. The size of the bubble indicates the number of target genes enriched in the pathway, and the color of the bubble represents a different p-value range. Fold enrichment is the ratio of DEGs numbers annotated in this pathway term to all gene numbers annotated in this pathway term.
FIGURE 4
FIGURE 4
Dynamic expression of mRNAs during goat rumen development. (A) Heatmap of DEGs during rumen development. (B) WGCNA co-expression network analysis of the rumens. Modules of co-expressed genes were assigned a unique colour and number (M1-M9). (C–E) KEGG analysis of the DEGs in the M6 (C), M2 (D), and M5 (E) modules. Top 10 KEGG pathway enrichment terms. The horizontal axis represents a rich factor and the vertical axis represents the pathway. The size of the bubble indicates the number of target genes enriched in the pathway, and the color of the bubble represents a different p-value range. Fold enrichment is the ratio of DEGs numbers annotated in this pathway term to all gene numbers annotated in this pathway term.
FIGURE 5
FIGURE 5
The GO and KEGG analysis of the target genes of DELs. (A) Top30 GO enrichment terms of the target genes of DELs. (B) Top 30 KEGG pathway enrichment terms of the target genes of DELs. Enriched GO terms and KEGG pathways associated with F60 vs. F135 are indicated in blue, F135 vs. BW30 are indicated in purple, BW30 vs. AW150 are indicated in pink. (C) The expression level of DELs in the key pathway.
FIGURE 6
FIGURE 6
The GO and KEGG analysis of the DEGs. (A) Top 30 GO enrichment terms of the DEGs. (B) Top 30 KEGG pathway enrichment terms of the DEGs. Enriched GO terms and KEGG pathways associated with F60 vs. F135 are indicated in blue, F135 vs. BW30 are indicated in purple, BW30 vs. AW150 are indicated in pink. (C) The expression fold change of DEGs in the key pathway.
FIGURE 7
FIGURE 7
Network plot of candidate lncRNAs and mRNAs. Pink squares indicate lncRNAs and light blue circles indicate mRNAs. The graph size represents the FPKM of lncRNAs and mRNAs.

Similar articles

References

    1. Alvarez-Dominguez J. R., Bai Z., Xu D., Yuan B., Lo K. A., Yoon M. J., et al. (2015). De novo reconstruction of adipose tissue transcriptomes reveals long non-coding RNA regulators of Brown adipocyte development. Cell Metab. 21, 764–776. 10.1016/j.cmet.2015.04.003 - DOI - PMC - PubMed
    1. Becker H. M. (2020). Carbonic anhydrase IX and acid transport in cancer. Br. J. Cancer 122, 157–167. 10.1038/s41416-019-0642-z - DOI - PMC - PubMed
    1. Berends H., van Reenen C. G., Stockhofe-Zurwieden N., Gerrits W. J. J. (2012). Effects of early rumen development and solid feed composition on growth performance and abomasal health in veal calves. J. Dairy Sci. 95, 3190–3199. 10.3168/jds.2011-4643 - DOI - PubMed
    1. Bhat S. A., Ahmad S. M., Mumtaz P. T., Malik A. A., Dar M. A., Urwat U., et al. (2010). Long non-coding RNAs: Mechanism of action and functional utility. Noncoding. RNA Res. 1, 43–50. 10.1016/j.ncrna.2016.11.002 - DOI - PMC - PubMed
    1. Bondzio A., Gabler C., Badewien-Rentzsch B., Schulze P., Martens H., Einspanier R. (2011). Identification of differentially expressed proteins in ruminal epithelium in response to a concentrate-supplemented diet. Am. J. Physiol. Gastrointest. Liver Physiol. 301, G260–G268. 10.1152/ajpgi.00304.2010 - DOI - PubMed