. 2022 Aug 24:13:977431.
doi: 10.3389/fphys.2022.977431. eCollection 2022.

A sensitive mitochondrial thermometry 2.0 and the availability of thermogenic capacity of brown adipocyte

Affiliations

A sensitive mitochondrial thermometry 2.0 and the availability of thermogenic capacity of brown adipocyte

Xiao-Yan Meng et al. Front Physiol. .

Abstract

The temperature of a living cell is a crucial parameter for cellular events, such as cell division, gene expressions, enzyme activities and metabolism. We previously developed a quantifiable mitochondrial thermometry 1.0 based on rhodamine B methyl ester (RhB-ME) and rhodamine 800 (Rh800), and the theory for mitochondrial thermogenesis. Given that the synthesized RhB-ME is not readily available, thus, a convenient mitochondrial thermometry 2.0 based on tetra-methyl rhodamine methyl ester (TMRM) and Rh800 for the thermogenic study of brown adipocyte was further evolved. The fluorescence of TMRM is more sensitive (∼1.4 times) to temperature than that of RhB-ME, then the TMRM-based mito-thermometry 2.0 was validated and used for the qualitatively dynamic profiles for mitochondrial thermogenic responses and mitochondrial membrane potential in living cells simultaneously. Furthermore, our results demonstrated that the heterogenous thermogenesis evoked by β3 adrenoceptor agonist only used overall up to ∼46% of the thermogenic capacity evoked by CCCP stimulation. On the other hand, the results demonstrated that the maximum thermogenesis evoked by NE and oligomycin A used up to ∼79% of the thermogenic capacity, which suggested the maximum thermogenic capacity under physiological conditions by inhibiting the proton-ATPase function of the mitochondrial complex V, such as under the cold activation of sympathetic nerve and the co-release of sympathetic transmitters.

Keywords: Rh800; TMRM; brown adipocytes; mitochondrial thermometry 2.0; thermogenesis.


Conflict of interest statement

CFL is employed by the Company RevoImmune Therapeutics Co., Ltd. The remaining authors declare that the research was conducted in the absence of any commercial or financial relationships that could be construed as a potential conflict of interest.

Figures

FIGURE 1
FIGURE 1
The summary for the characteristics of rhodamine dyes. (A–G), the structure of rhodamine dyes. (A), RhB (rhodamine B). (B), RhB-ME (rhodamine B methyl ester). (C), TMRM (tetra-methyl rhodamine methyl ester). (D), TMRE (tetra-methyl rhodamine ethyl ester). (E), Rh800 (rhodamine 800). (F), Rh123 (rhodamine 123). (G), Rh110 (rhodamine 110). (H–N), Co-localization of rhodamine dyes with mt-GFP or mt-RFP in COS7 cells. RhB (H) and Rh110 (N) are unable to target in mitochondria, while RhB-ME (I), TMRM (J), TMRE (K), Rh800 (L) and Rh123 (M) target mitochondria very well. (O), the summary of the characteristics of rhodamine dyes.
FIGURE 2
FIGURE 2
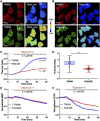
The thermochromic mechanism and temperature sensitivity of TMRM. (A), the emission spectra of 10 μM TMRM (solid lines) from 5 to 45°C, respectively. (B), the Arrhenius plot for TMRM thermochromic transformation in aqueous solution. The black solid line indicates the Arrhenius fitting to the peak values (red square) of TMRM data in panel A. The inset shows the Arrhenius plot. (C), the thermal energy (∼5.4 kBT at 25°C) converts single TMRM fluorescent molecule to its nonfluorescent form. D-G, brown adipocytes were co-stained with 50 nM of Rh800 and 50 nM of TMRM (D), or 50 nM of Rh800 and 50 nM of RhB-ME (E), and then incubated at 27°C or 37°C. (D,E), the representative fluorescence images and thermal ratio images of brown adipocytes at 27°C or 37°C. The pseudo-color ratio of Rh800 to TMRM (D) or Rh800 to RhB-ME (E) represented thermal status. Scale bars, 20 μm. (F), the scatter plot with boxplots showed the changes in fluorescent intensity of RH800, TMRM and RhB-ME from 27 to 37°C. The results showed that the fluorescent intensity of Rh800 co-stained with TMRM (T_Rh800, n = 120) and co-stained with RhB-ME (R_Rh800, n = 71) changed slightly after increasing temperature. The fluorescence intensity of TMRM (n = 120) dropped significantly more than that of RhB-ME (n = 71). (G), the scatter plot with boxplots showed the thermal ratio of Rh800 to TMRM (n = 120) was significantly larger than the ratio of Rh800 to RhB-ME (n = 71). Box and whiskers. Min to Max. Each point represented a single cell.
FIGURE 3
FIGURE 3
TMRM is more temperature thermosensitive than RhB-ME. (A–F), brown adipocytes were co-stained with 20 nM of Rh800 and 20 nM of TMRM, or 20 nM Rh800 and 20 nM RhB-ME, and co-treated with 0.1 μM NE and 10 μg ml-1 oligomycin A after 5 min of imaging. (A,B), the representative fluorescent images of brown adipocytes before the stimulation, and thermal ratio images before and after co-treatment. The pseudo-color ratios of Rh800 to TMRM (A) or Rh800 to RhB-ME (B) represented thermogenic responses. Scale bars, 20 μm. (C), the thermal ratio of Rh800 and TMRM compared with the ratio of Rh800 and RhB-ME in brown adipocyte. After the co-treatments of NE and oligomycin A in brown adipocytes, the thermal ratios of Rh800 to TMRM (blue line, n = 47) changed more dramatical than the ratios of Rh800 to RhB-ME (red line, n = 63). (D), the scatter plot with boxplots showed that the ratios of Rh800 to TMRM (blue box, n = 47) were generally greater than the ratios of Rh800 to RhB-ME (red box, n = 63) (t tests, p = 1.58 × 10⁻¹⁵). Box and whiskers. Min to Max. Each point represents a single cell. (E), the fluorescent intensity of Rh800 represented the MMP dynamics of brown adipocytes. The results showed that the brown adipocytes co-stained Rh800 with TMRM (blue line, n = 47) or RhB-ME (red line, n = 63) had similar MMP dynamics. (F), the comparison of the fluorescent intensity changes of TMRM (blue line, n = 47) or RhB-ME (red line, n = 63) in brown adipocytes. All data points represented mean +s.e.m.
FIGURE 4
FIGURE 4
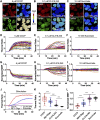
Endogenous thermogenic studies with the mitochondrial thermometry 2.0 in BA. (A–F), the endogenous thermogenesis tests with the mitochondrial thermometry 2.0 in brown adipocytes. The pseudo-color ratios of Rh800 to TMRM represented thermogenic responses, and the fluorescent intensity of Rh800 represented MMP. After 5 min of live cell imaging for the base line under resting condition, brown adipocyte was treated with 5 μM of CCCP, 0.1 μM of NE with 10 μg ml-1 of oligomycin A pretreatment, 0.1 μM of CL316,243 or 10 mM of succinate. Mitochondrial thermogenic responses and MMP dynamics were simultaneously imaged for data analyses (D–K). (A–C), were representative fluorescent images (Rh800 and TMRM) and their pseudo-color thermal ratios of Rh800 to TMRM in brown adipocytes before and after the treatments of CCCP (A), CL316,243 (B) or succinate (C), respectively. Scale bars, 20 μm. (D–F), the thermogenic responses in brown adipocytes evoked by CCCP [(D), n = 41], CL316,243 [(E), n = 91] or succinate [(F), n = 87], respectively. Each colored trace represented a single brown adipocyte [in (D–F)]. (A,D), the brown adipocytes treated with CCCP (n = 41) showed high thermogenic efficiency and large responses. (B,E), demonstrated the relatively low thermogenic efficacy of CL316,243 (n = 91) in brown adipocytes. (C,F), showed that succinate (n = 87) stimulation did not have thermogenic effect in brown adipocytes. (G–I), the raw data plots of MMP changes in brown adipocytes treated with CCCP [(H), n = 41], CL316,243 [(I), n = 91] or succinate [(G), n = 87]. Each colored curve represented a single brown adipocyte. (G), the results showed the depolarization of MMP in brown adipocytes treated with CCCP (n = 41). (H), there were two populations of MMP changes (hyperpolarization and depolarization) in brown adipocytes treated with CL316,243 (n = 91). (I), succinate treatment didn’t affect MMP in brown adipocytes. (J), the summary and comparison of the averaged thermogenic responses of brown adipocytes evoked by CCCP (red line, n = 41), NE and oligomycin A co-treatment (blue line, n = 47), CL316,243 (purple line, n = 91) or 10 mM succinate (black line, n = 87). (K), scatter plotting the thermogenic ratio values with boxplots for CCCP (red box, n = 41), NE + Oligomycin A (blue box, n = 47), CL316,243 (purple box, n = 91) and succinate (black box, n = 87) treatments on brown adipocytes. (L), scatter plotting the normalized MMP with boxplots under the stimulations of CCCP (red box, n = 41), NE + Oligomycin A (blue box, n = 47), CL316,243 (purple box, n = 91) and succinate (black box, n = 87). In (K,L), each point represented a single brown adipocyte.

References

    1. Barbosa M. A., Guerra-Sá R., De Castro U. G. M., de Lima W. G., dos Santos R. A. S., Campagnole-Santos M. J., et al. (2018). Physical training improves thermogenesis and insulin pathway, and induces remodeling in white and Brown adipose tissues. J. Physiol. Biochem. 74, 441–454. 10.1007/s13105-018-0637-x PubMed Abstract | 10.1007/s13105-018-0637-x | Google Scholar - DOI - DOI - PubMed
    1. Blüher M. (2019). Obesity: Global epidemiology and pathogenesis. Nat. Rev. Endocrinol. 15, 288–298. 10.1038/s41574-019-0176-8 PubMed Abstract | 10.1038/s41574-019-0176-8 | Google Scholar - DOI - DOI - PubMed
    1. Chazotte B. (2011). Labeling mitochondria with TMRM or TMRE. Cold Spring Harb. Protoc. 2011, 895–897. 10.1101/pdb.prot5641 PubMed Abstract | 10.1101/pdb.prot5641 | Google Scholar - DOI - DOI - PubMed
    1. Chouchani E. T., Kazak L., Jedrychowski M. P., Lu G. Z., Erickson B. K., Szpyt J., et al. (2016). Mitochondrial ROS regulate thermogenic energy expenditure and sulfenylation of UCP1. Nature 532, 112–116. 10.1038/nature17399 PubMed Abstract | 10.1038/nature17399 | Google Scholar - DOI - DOI - PMC - PubMed
    1. Chrétien D., Bénit P., Leroy C., El-Khoury R., Park S., Lee J. Y., et al. (2020). Pitfalls in monitoring mitochondrial temperature using charged thermosensitive fluorophores. Chemosensors 8, 124. 10.3390/chemosensors8040124 10.3390/chemosensors8040124 | Google Scholar - DOI - DOI

LinkOut - more resources