3D-printed collagen/silk fibroin/secretome derived from bFGF-pretreated HUCMSCs scaffolds enhanced therapeutic ability in canines traumatic brain injury model
- PMID: 36091465
- PMCID: PMC9449499
- DOI: 10.3389/fbioe.2022.995099
3D-printed collagen/silk fibroin/secretome derived from bFGF-pretreated HUCMSCs scaffolds enhanced therapeutic ability in canines traumatic brain injury model
Abstract
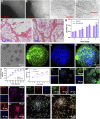
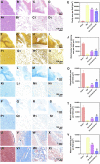
The regeneration of brain tissue poses a great challenge because of the limited self-regenerative capabilities of neurons after traumatic brain injury (TBI). For this purpose, 3D-printed collagen/silk fibroin/secretome derived from human umbilical cord blood mesenchymal stem cells (HUCMSCs) pretreated with bFGF scaffolds (3D-CS-bFGF-ST) at a low temperature were prepared in this study. From an in vitro perspective, 3D-CS-bFGF-ST showed good biodegradation, appropriate mechanical properties, and good biocompatibility. In regard to vivo, during the tissue remodelling processes of TBI, the regeneration of brain tissues was obviously faster in the 3D-CS-bFGF-ST group than in the other two groups (3D-printed collagen/silk fibroin/secretome derived from human umbilical cord blood mesenchymal stem cells (3D-CS-ST) group and TBI group) by motor assay, histological analysis, and immunofluorescence assay. Satisfactory regeneration was achieved in the two 3D-printed scaffold-based groups at 6 months postsurgery, while the 3D-CS-bFGF-ST group showed a better outcome than the 3D-CS-ST group.
Keywords: bFGF; collagen; human umbilical cord blood mesenchymal stem cells; secretome; silk fibroin; traumatic brain injury.
Copyright © 2022 Liu, Zhang, Wei, Hao, Zhong, Zhong, Liu, Liu, Feng, Wang, Zhang, Tian and Zhou.
Conflict of interest statement
The authors declare that the research was conducted in the absence of any commercial or financial relationships that could be construed as a potential conflict of interest.
Figures


Similar articles
-
3D printing of injury-preconditioned secretome/collagen/heparan sulfate scaffolds for neurological recovery after traumatic brain injury in rats.Stem Cell Res Ther. 2022 Dec 19;13(1):525. doi: 10.1186/s13287-022-03208-0. Stem Cell Res Ther. 2022. PMID: 36536463 Free PMC article.
-
Hypoxia-pretreated mesenchymal stem cell-derived exosomes-loaded low-temperature extrusion 3D-printed implants for neural regeneration after traumatic brain injury in canines.Front Bioeng Biotechnol. 2022 Sep 30;10:1025138. doi: 10.3389/fbioe.2022.1025138. eCollection 2022. Front Bioeng Biotechnol. 2022. PMID: 36246376 Free PMC article.
-
Three-dimensional-printed collagen/chitosan/secretome derived from HUCMSCs scaffolds for efficient neural network reconstruction in canines with traumatic brain injury.Regen Biomater. 2022 Jun 27;9:rbac043. doi: 10.1093/rb/rbac043. eCollection 2022. Regen Biomater. 2022. PMID: 35855109 Free PMC article.
-
3D printed collagen/silk fibroin scaffolds carrying the secretome of human umbilical mesenchymal stem cells ameliorated neurological dysfunction after spinal cord injury in rats.Regen Biomater. 2022 Feb 24;9:rbac014. doi: 10.1093/rb/rbac014. eCollection 2022. Regen Biomater. 2022. PMID: 35480857 Free PMC article.
-
Recovery of motor function in rats with complete spinal cord injury following implantation of collagen/silk fibroin scaffold combined with human umbilical cord-mesenchymal stem cells.Rev Assoc Med Bras (1992). 2021 Sep;67(9):1342-1348. doi: 10.1590/1806-9282.20200697. Rev Assoc Med Bras (1992). 2021. PMID: 34816932
Cited by
-
Bottom-up Biomaterial strategies for creating tailored stem cells in regenerative medicine.Front Bioeng Biotechnol. 2025 May 20;13:1581292. doi: 10.3389/fbioe.2025.1581292. eCollection 2025. Front Bioeng Biotechnol. 2025. PMID: 40462840 Free PMC article. Review.
-
Enhancing Wound Healing Through Secretome-Loaded 3D-Printed Biomaterials.Gels. 2025 Jun 20;11(7):476. doi: 10.3390/gels11070476. Gels. 2025. PMID: 40710638 Free PMC article. Review.
-
Current Biomedical Applications of 3D-Printed Hydrogels.Gels. 2023 Dec 21;10(1):8. doi: 10.3390/gels10010008. Gels. 2023. PMID: 38275845 Free PMC article. Review.
-
Neural stem cell-derived small extracellular vesicles: a new therapy approach in neurological diseases.Front Immunol. 2025 Apr 16;16:1548206. doi: 10.3389/fimmu.2025.1548206. eCollection 2025. Front Immunol. 2025. PMID: 40308614 Free PMC article. Review.
-
3D printing of injury-preconditioned secretome/collagen/heparan sulfate scaffolds for neurological recovery after traumatic brain injury in rats.Stem Cell Res Ther. 2022 Dec 19;13(1):525. doi: 10.1186/s13287-022-03208-0. Stem Cell Res Ther. 2022. PMID: 36536463 Free PMC article.
References
LinkOut - more resources
Full Text Sources

