

Hyaluronic acid-based nano drug delivery systems for breast cancer treatment: Recent advances
- PMID: 36091467
- PMCID: PMC9449492
- DOI: 10.3389/fbioe.2022.990145
Hyaluronic acid-based nano drug delivery systems for breast cancer treatment: Recent advances
Abstract
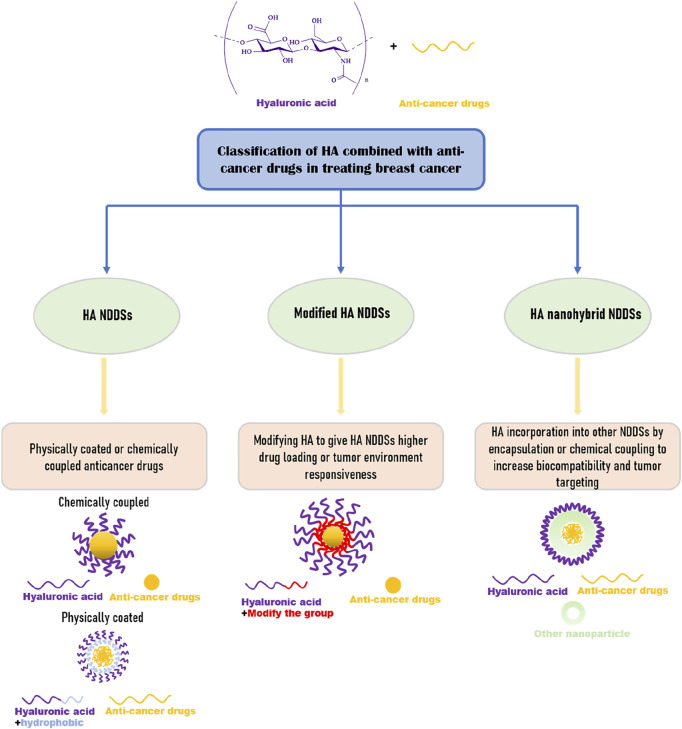
Breast cancer (BC) is the most common malignancy among females worldwide, and high resistance to drugs and metastasis rates are the leading causes of death in BC patients. Releasing anti-cancer drugs precisely to the tumor site can improve the efficacy and reduce the side effects on the body. Natural polymers are attracting extensive interest as drug carriers in treating breast cancer. Hyaluronic acid (HA) is a natural polysaccharide with excellent biocompatibility, biodegradability, and non-immunogenicity and is a significant component of the extracellular matrix. The CD44 receptor of HA is overexpressed in breast cancer cells and can be targeted to breast tumors. Therefore, many researchers have developed nano drug delivery systems (NDDS) based on the CD44 receptor tumor-targeting properties of HA. This review examines the application of HA in NDDSs for breast cancer in recent years. Based on the structural composition of NDDSs, they are divided into HA NDDSs, Modified HA NDDSs, and HA hybrid NDDSs.
Keywords: anticancer drugs; breast cancer; drug delivery system (DDS); hyaluronic acid; nanoparticles.
Copyright © 2022 Jia, Chen, Wang, Sun and Yang.
Conflict of interest statement
The authors declare that the research was conducted in the absence of any commercial or financial relationships that could be construed as a potential conflict of interest.
Figures
Similar articles
-
Hyaluronan-based Multifunctional Nano-carriers for Combination Cancer Therapy.Curr Top Med Chem. 2021;21(2):126-139. doi: 10.2174/1568026620666200922113846. Curr Top Med Chem. 2021. PMID: 32962617 Review.
-
Development of a Hyaluronic Acid-Based Nanocarrier Incorporating Doxorubicin and Cisplatin as a pH-Sensitive and CD44-Targeted Anti-Breast Cancer Drug Delivery System.Front Pharmacol. 2020 Aug 28;11:532457. doi: 10.3389/fphar.2020.532457. eCollection 2020. Front Pharmacol. 2020. PMID: 32982750 Free PMC article.
-
Antitumor therapy for breast cancer: Focus on tumor-associated macrophages and nanosized drug delivery systems.Cancer Med. 2023 May;12(10):11049-11072. doi: 10.1002/cam4.5489. Epub 2023 Feb 16. Cancer Med. 2023. PMID: 36794651 Free PMC article. Review.
-
Hyaluronic Acid-Based Nanocarriers for Anticancer Drug Delivery.Polymers (Basel). 2023 May 16;15(10):2317. doi: 10.3390/polym15102317. Polymers (Basel). 2023. PMID: 37242892 Free PMC article. Review.
-
Reversibly crosslinked hyaluronic acid nanoparticles for active targeting and intelligent delivery of doxorubicin to drug resistant CD44+ human breast tumor xenografts.J Control Release. 2015 May 10;205:144-54. doi: 10.1016/j.jconrel.2015.01.012. Epub 2015 Jan 14. J Control Release. 2015. PMID: 25596560
Cited by
-
Folic acid grafted mixed polymeric micelles as a targeted delivery strategy for tamoxifen citrate in treatment of breast cancer.Drug Deliv Transl Res. 2024 Apr;14(4):945-958. doi: 10.1007/s13346-023-01443-3. Epub 2023 Oct 31. Drug Deliv Transl Res. 2024. PMID: 37906415 Free PMC article.
-
Advances in drug delivery systems, challenges and future directions.Heliyon. 2023 Jun 24;9(6):e17488. doi: 10.1016/j.heliyon.2023.e17488. eCollection 2023 Jun. Heliyon. 2023. PMID: 37416680 Free PMC article. Review.
-
Global trends and research hotspots in nanodrug delivery systems for breast cancer therapy: a bibliometric analysis (2013-2023).Discov Oncol. 2025 Mar 6;16(1):269. doi: 10.1007/s12672-025-02014-3. Discov Oncol. 2025. PMID: 40047951 Free PMC article.
-
Complexed hyaluronic acid-based nanoparticles in cancer therapy and diagnosis: Research trends by natural language processing.Heliyon. 2024 Dec 18;11(1):e41246. doi: 10.1016/j.heliyon.2024.e41246. eCollection 2025 Jan 15. Heliyon. 2024. PMID: 39811313 Free PMC article.
-
Optically Controlled Drug Delivery Through Microscale Brain-Machine Interfaces Using Integrated Upconverting Nanoparticles.Sensors (Basel). 2024 Dec 14;24(24):7987. doi: 10.3390/s24247987. Sensors (Basel). 2024. PMID: 39771721 Free PMC article.
References
-
- Agrawal S., Dwivedi M., Ahmad H., Chadchan S. B., Arya A., Sikandar R., et al. (2018). CD44 Targeting Hyaluronic Acid Coated Lapatinib Nanocrystals Foster the Efficacy against Triple-Negative Breast Cancer. Nanomedicine Nanotechnol. Biol. Med. 14 (2), 327–337. 10.1016/j.nano.2017.10.010 - DOI - PubMed
Publication types
LinkOut - more resources
Full Text Sources
Miscellaneous