

Automated deep learning-based segmentation of COVID-19 lesions from chest computed tomography images
- PMID: 36091652
- PMCID: PMC9453472
- DOI: 10.5114/pjr.2022.119027
Automated deep learning-based segmentation of COVID-19 lesions from chest computed tomography images
Abstract
Purpose: The novel coronavirus COVID-19, which spread globally in late December 2019, is a global health crisis. Chest computed tomography (CT) has played a pivotal role in providing useful information for clinicians to detect COVID-19. However, segmenting COVID-19-infected regions from chest CT results is challenging. Therefore, it is desirable to develop an efficient tool for automated segmentation of COVID-19 lesions using chest CT. Hence, we aimed to propose 2D deep-learning algorithms to automatically segment COVID-19-infected regions from chest CT slices and evaluate their performance.
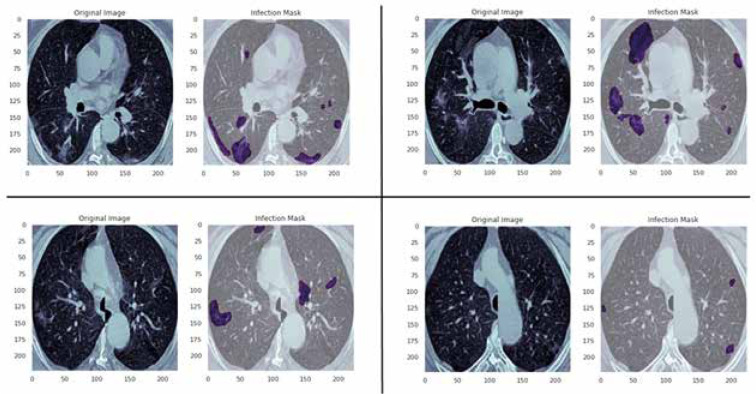
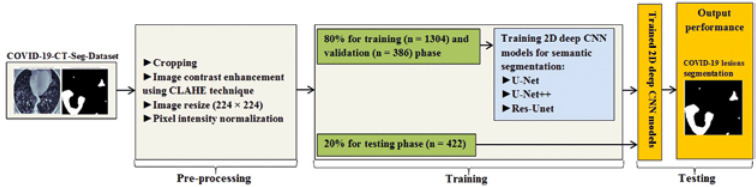
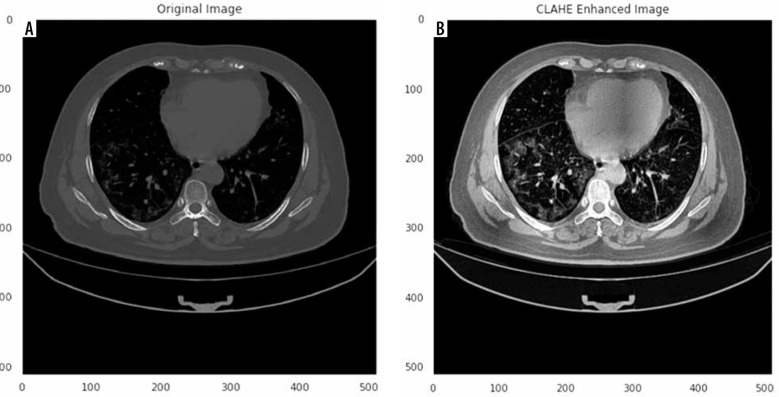
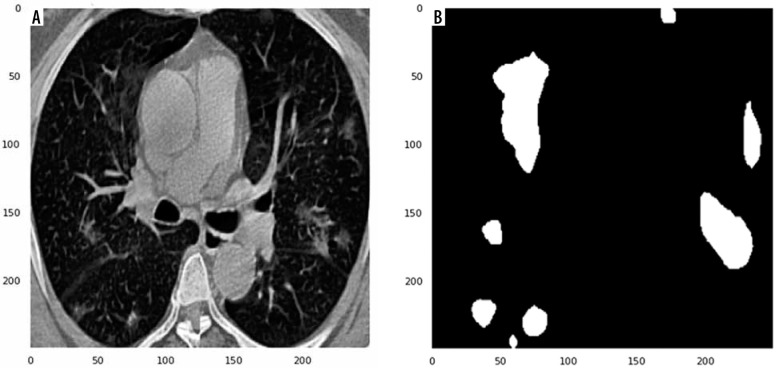
Material and methods: Herein, 3 known deep learning networks: U-Net, U-Net++, and Res-Unet, were trained from scratch for automated segmenting of COVID-19 lesions using chest CT images. The dataset consists of 20 labelled COVID-19 chest CT volumes. A total of 2112 images were used. The dataset was split into 80% for training and validation and 20% for testing the proposed models. Segmentation performance was assessed using Dice similarity coefficient, average symmetric surface distance (ASSD), mean absolute error (MAE), sensitivity, specificity, and precision.
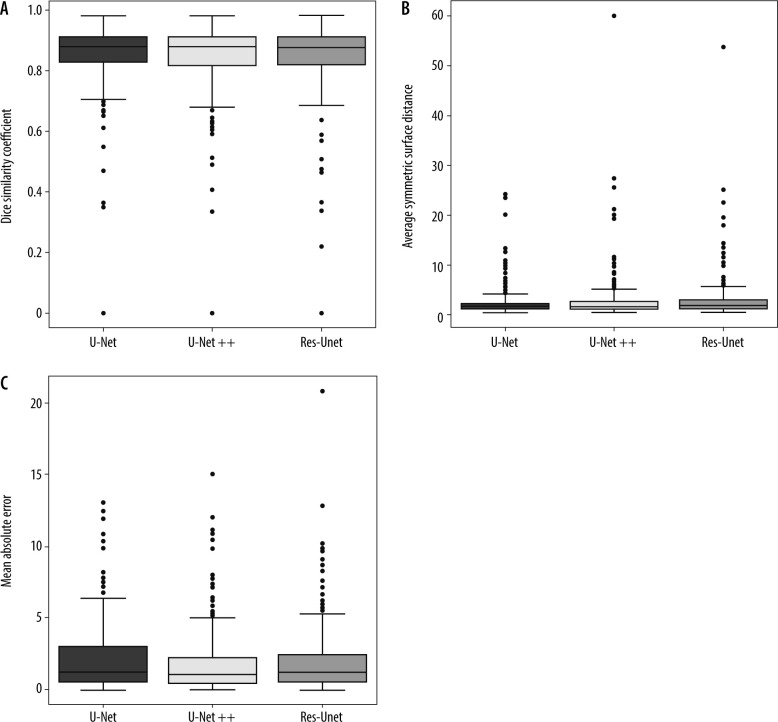
Results: All proposed models achieved good performance for COVID-19 lesion segmentation. Compared with Res-Unet, the U-Net and U-Net++ models provided better results, with a mean Dice value of 85.0%. Compared with all models, U-Net gained the highest segmentation performance, with 86.0% sensitivity and 2.22 mm ASSD. The U-Net model obtained 1%, 2%, and 0.66 mm improvement over the Res-Unet model in the Dice, sensitivity, and ASSD, respectively. Compared with Res-Unet, U-Net++ achieved 1%, 2%, 0.1 mm, and 0.23 mm improvement in the Dice, sensitivity, ASSD, and MAE, respectively.
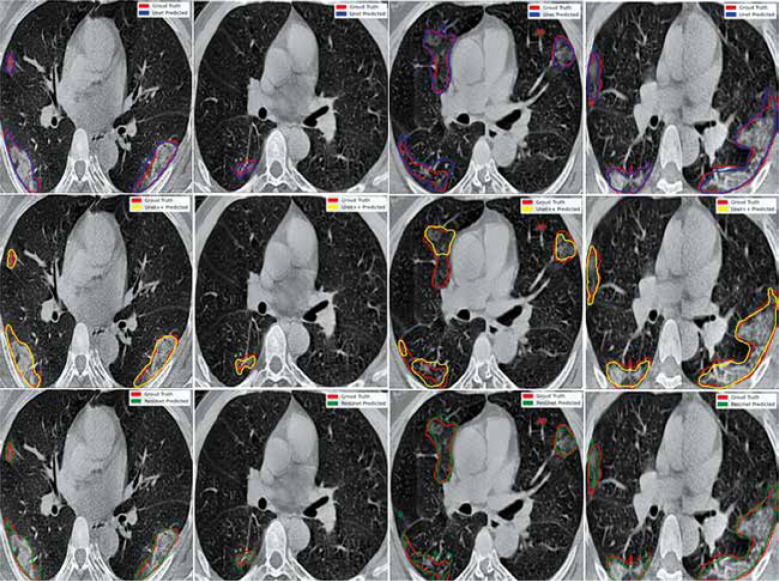
Conclusions: Our data indicated that the proposed models achieve an average Dice value greater than 84.0%. Two-dimensional deep learning models were able to accurately segment COVID-19 lesions from chest CT images, assisting the radiologists in faster screening and quantification of the lesion regions for further treatment. Nevertheless, further studies will be required to evaluate the clinical performance and robustness of the proposed models for COVID-19 semantic segmentation.
Keywords: COVID-19; computed tomography; deep learning; image segmentation; infection segmentation.
© Pol J Radiol 2022.
Conflict of interest statement
The authors report no conflict of interest.
Figures
Similar articles
-
Dual attention fusion UNet for COVID-19 lesion segmentation from CT images.J Xray Sci Technol. 2023;31(4):713-729. doi: 10.3233/XST-230001. J Xray Sci Technol. 2023. PMID: 37092210
-
CARes-UNet: Content-aware residual UNet for lesion segmentation of COVID-19 from chest CT images.Med Phys. 2021 Nov;48(11):7127-7140. doi: 10.1002/mp.15231. Epub 2021 Sep 25. Med Phys. 2021. PMID: 34528263 Free PMC article.
-
Automatic segmentation of prostate cancer metastases in PSMA PET/CT images using deep neural networks with weighted batch-wise dice loss.Comput Biol Med. 2023 May;158:106882. doi: 10.1016/j.compbiomed.2023.106882. Epub 2023 Apr 4. Comput Biol Med. 2023. PMID: 37037147
-
Evolution of deep learning tooth segmentation from CT/CBCT images: a systematic review and meta-analysis.BMC Oral Health. 2025 May 26;25(1):800. doi: 10.1186/s12903-025-05984-6. BMC Oral Health. 2025. PMID: 40420051 Free PMC article.
-
Deep learning image segmentation approaches for malignant bone lesions: a systematic review and meta-analysis.Front Radiol. 2023 Aug 8;3:1241651. doi: 10.3389/fradi.2023.1241651. eCollection 2023. Front Radiol. 2023. PMID: 37614529 Free PMC article. Review.
Cited by
-
Strong semantic segmentation for Covid-19 detection: Evaluating the use of deep learning models as a performant tool in radiography.Radiography (Lond). 2023 Jan;29(1):109-118. doi: 10.1016/j.radi.2022.10.010. Epub 2022 Oct 24. Radiography (Lond). 2023. PMID: 36335787 Free PMC article.
-
Fully automated clinical target volume segmentation for glioblastoma radiotherapy using a deep convolutional neural network.Pol J Radiol. 2023 Jan 19;88:e31-e40. doi: 10.5114/pjr.2023.124434. eCollection 2023. Pol J Radiol. 2023. PMID: 36819221 Free PMC article.
References
-
- WHO . Novel Coronavirus – China 2020. Available from: https://www.who.int/csr/don/12-january-2020-novel-coronavirus-china/en/.
-
- Worldometer Coronavirus. Available from: https://www.worldometers.info/coronavirus/ [Accessed: 14.01.2022].
LinkOut - more resources
Full Text Sources