

Prediction of low cardiac output syndrome in patients following cardiac surgery using machine learning
- PMID: 36091676
- PMCID: PMC9448978
- DOI: 10.3389/fmed.2022.973147
Prediction of low cardiac output syndrome in patients following cardiac surgery using machine learning
Abstract
Background: This study aimed to develop machine learning models to predict Low Cardiac Output Syndrome (LCOS) in patients following cardiac surgery using machine learning algorithms.
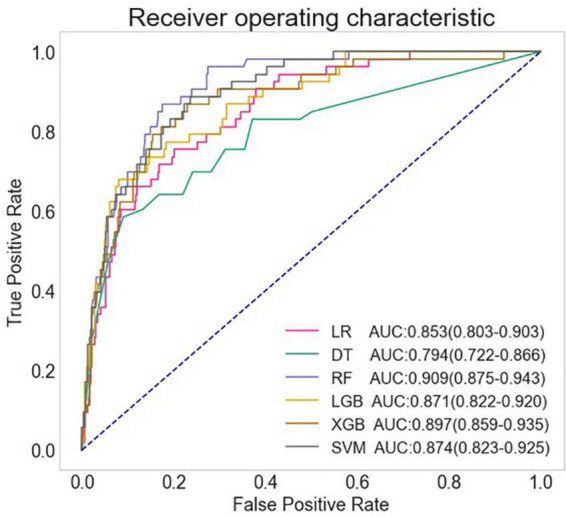
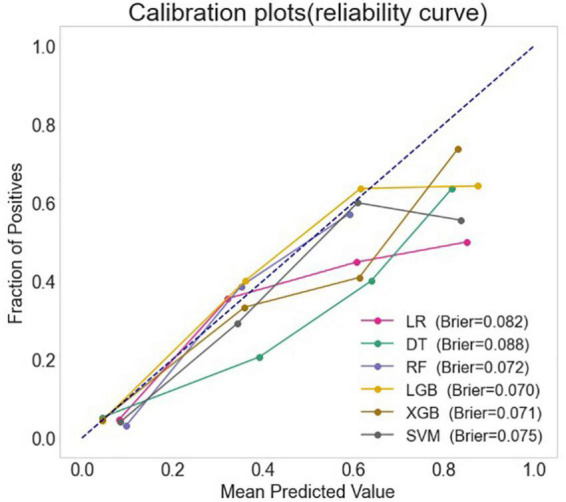
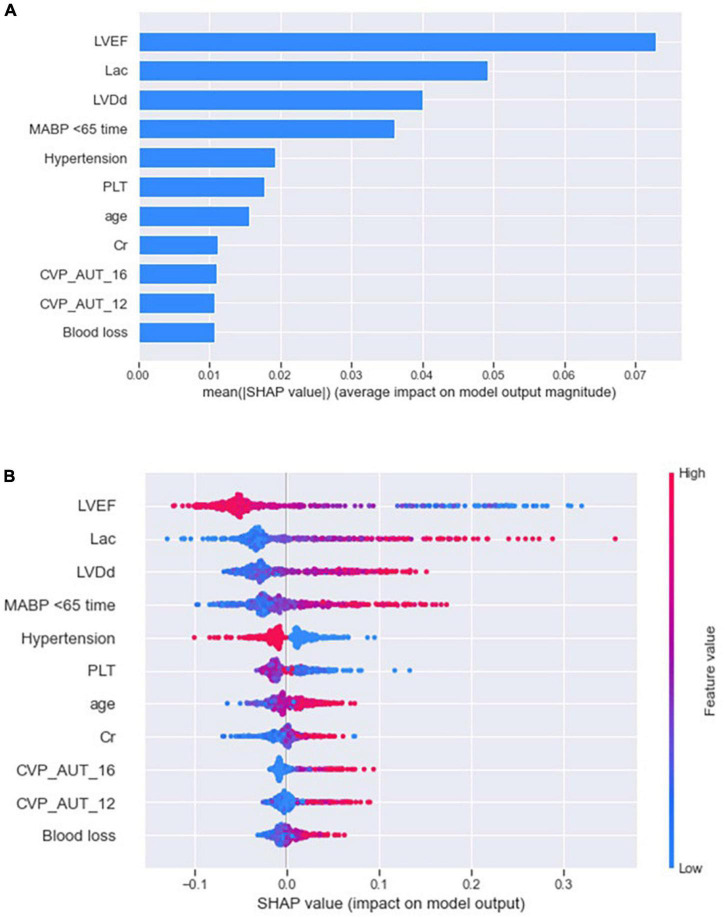
Methods: The clinical data of cardiac surgery patients in Nanjing First Hospital between June 2019 and November 2020 were retrospectively extracted from the electronic medical records. Six conventional machine learning algorithms, including logistic regression, support vector machine, decision tree, random forest, extreme gradient boosting and light gradient boosting machine, were employed to construct the LCOS predictive models with all predictive features (full models) and selected predictive features (reduced models). The discrimination of these models was evaluated by the area under the receiver operating characteristic curve (AUC) and the calibration of the models was assessed by the calibration curve. Shapley Additive explanation (SHAP) and Local Interpretable Model-Agnostic Explanations (LIME) were used to interpret the predictive models.
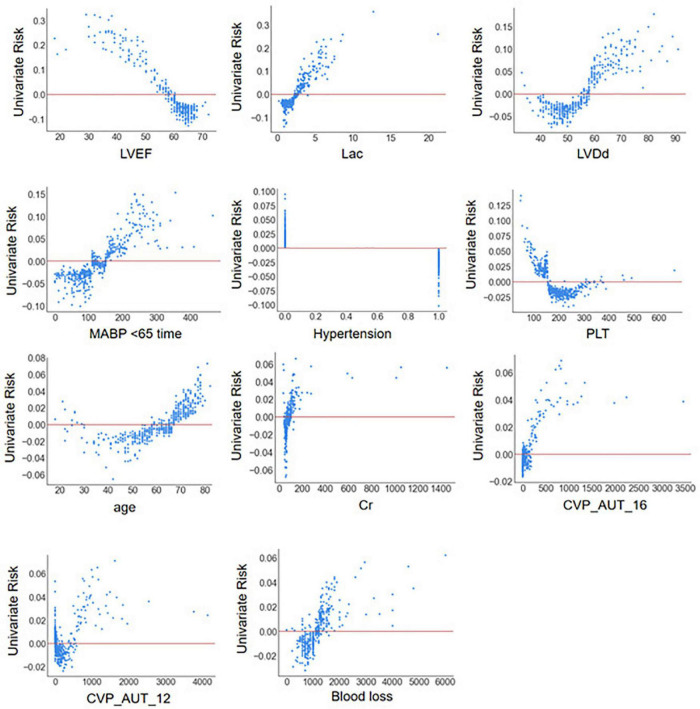
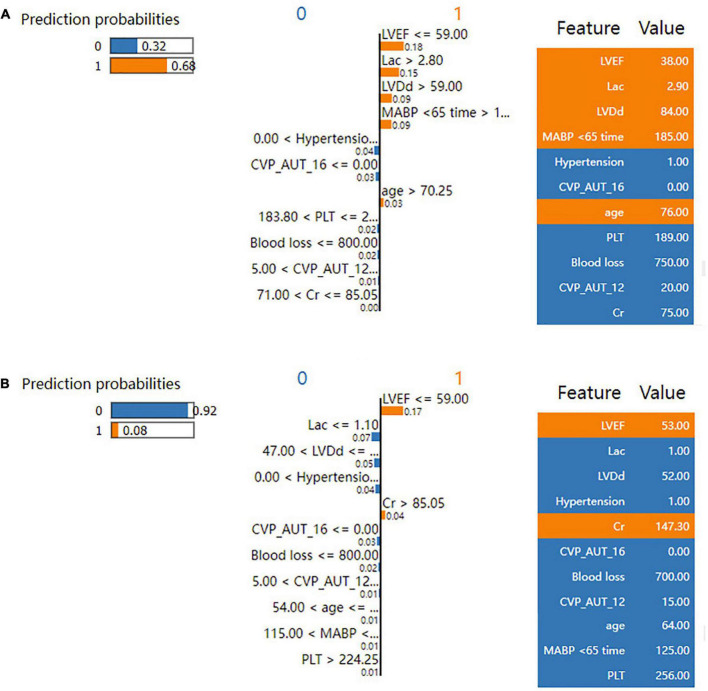
Results: Data from 1,585 patients [982 (62.0%) were male, aged 18 to 88, 212 (13.4%) with LCOS] were employed to train and validate the LCOS models. Among the full models, the RF model (AUC: 0.909, 95% CI: 0.875-0.943; Sensitivity: 0.849, 95% CI: 0.724-0.933; Specificity: 0.835, 95% CI: 0.796-0.869) and the XGB model (AUC: 0.897, 95% CI: 0.859-0.935; Sensitivity: 0.830, 95% CI: 0.702-0.919; Specificity: 0.809, 95% CI: 0.768-0.845) exhibited well predictive power for LCOS. Eleven predictive features including left ventricular ejection fraction (LVEF), first post-operative blood lactate (Lac), left ventricular diastolic diameter (LVDd), cumulative time of mean artery blood pressure (MABP) lower than 65 mmHg (MABP < 65 time), hypertension history, platelets level (PLT), age, blood creatinine (Cr), total area under curve above threshold central venous pressure (CVP) 12 mmHg and 16 mmHg, and blood loss during operation were used to build the reduced models. Among the reduced models, RF model (AUC: 0.895, 95% CI: 0.857-0.933; Sensitivity: 0.830, 95% CI: 0.702-0.919; Specificity: 0.806, 95% CI: 0.765-0.843) revealed the best performance. SHAP and LIME plot showed that LVEF, Lac, LVDd and MABP < 65 time significantly contributed to the prediction model.
Conclusion: In this study, we successfully developed several machine learning models to predict LCOS after surgery, which may avail to risk stratification, early detection and management of LCOS after cardiac surgery.
Keywords: cardiac surgery; low cardiac output syndrome; machine learning; predictive model; risk stratification.
Copyright © 2022 Hong, Xu, Ge, Tao, Shen, Song, Guan and Zhang.
Conflict of interest statement
The authors declare that the research was conducted in the absence of any commercial or financial relationships that could be construed as a potential conflict of interest.
Figures
Similar articles
-
A novel interpretative tool for early prediction of low cardiac output syndrome after valve surgery: online machine learning models.Ann Med. 2023;55(2):2293244. doi: 10.1080/07853890.2023.2293244. Epub 2023 Dec 21. Ann Med. 2023. PMID: 38128272 Free PMC article.
-
Application of machine learning model in predicting the likelihood of blood transfusion after hip fracture surgery.Aging Clin Exp Res. 2023 Nov;35(11):2643-2656. doi: 10.1007/s40520-023-02550-4. Epub 2023 Sep 21. Aging Clin Exp Res. 2023. PMID: 37733228 Clinical Trial.
-
Prediction of the development of acute kidney injury following cardiac surgery by machine learning.Crit Care. 2020 Jul 31;24(1):478. doi: 10.1186/s13054-020-03179-9. Crit Care. 2020. PMID: 32736589 Free PMC article.
-
Predicting Acute Onset of Heart Failure Complicating Acute Coronary Syndrome: An Explainable Machine Learning Approach.Curr Probl Cardiol. 2023 Feb;48(2):101480. doi: 10.1016/j.cpcardiol.2022.101480. Epub 2022 Nov 3. Curr Probl Cardiol. 2023. PMID: 36336116 Review.
-
Risk factors of major bleeding detected by machine learning method in patients undergoing liver resection with controlled low central venous pressure technique.Postgrad Med J. 2023 Nov 20;99(1178):1280-1286. doi: 10.1093/postmj/qgad087. Postgrad Med J. 2023. PMID: 37794600 Review.
Cited by
-
Machine Learning-Based Cardiac Output Estimation Using Photoplethysmography in Off-Pump Coronary Artery Bypass Surgery.J Clin Med. 2024 Nov 26;13(23):7145. doi: 10.3390/jcm13237145. J Clin Med. 2024. PMID: 39685605 Free PMC article.
-
Preoperative consecutive treatment with isoprenaline and adenosine is safe and reduces ischaemia-reperfusion injury in a porcine model of cardiac surgery with recent acute myocardial infarction.Eur J Cardiothorac Surg. 2025 May 6;67(5):ezaf120. doi: 10.1093/ejcts/ezaf120. Eur J Cardiothorac Surg. 2025. PMID: 40184215 Free PMC article.
-
A novel interpretative tool for early prediction of low cardiac output syndrome after valve surgery: online machine learning models.Ann Med. 2023;55(2):2293244. doi: 10.1080/07853890.2023.2293244. Epub 2023 Dec 21. Ann Med. 2023. PMID: 38128272 Free PMC article.
-
Analysis of P(v-a)CO2/C(a-v)O2 Ratio and Other Perfusion Markers in a Population of 98 Pediatric Patients Undergoing Cardiac Surgery.J Clin Med. 2023 Sep 1;12(17):5700. doi: 10.3390/jcm12175700. J Clin Med. 2023. PMID: 37685767 Free PMC article.
-
A review of evaluation approaches for explainable AI with applications in cardiology.Artif Intell Rev. 2024;57(9):240. doi: 10.1007/s10462-024-10852-w. Epub 2024 Aug 9. Artif Intell Rev. 2024. PMID: 39132011 Free PMC article.
References
LinkOut - more resources
Full Text Sources
Research Materials