. 2022 Aug 24:13:933364.
doi: 10.3389/fphar.2022.933364. eCollection 2022.

Combined hyperforin and lanicemine treatment instead of ketamine or imipramine restores behavioral deficits induced by chronic restraint stress and dietary zinc restriction in mice

Affiliations

Combined hyperforin and lanicemine treatment instead of ketamine or imipramine restores behavioral deficits induced by chronic restraint stress and dietary zinc restriction in mice

Bartłomiej Pochwat et al. Front Pharmacol. .

Abstract

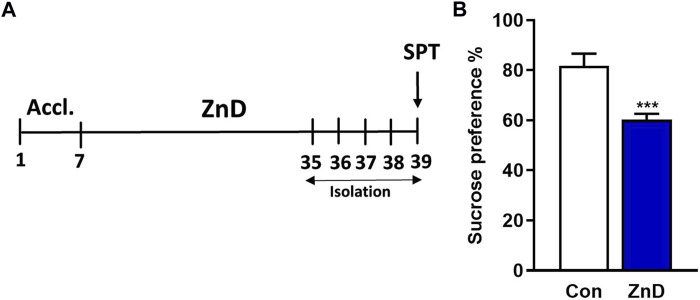
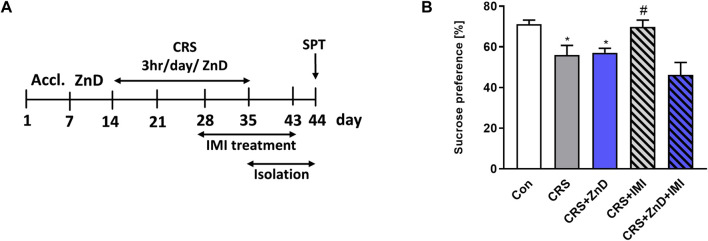
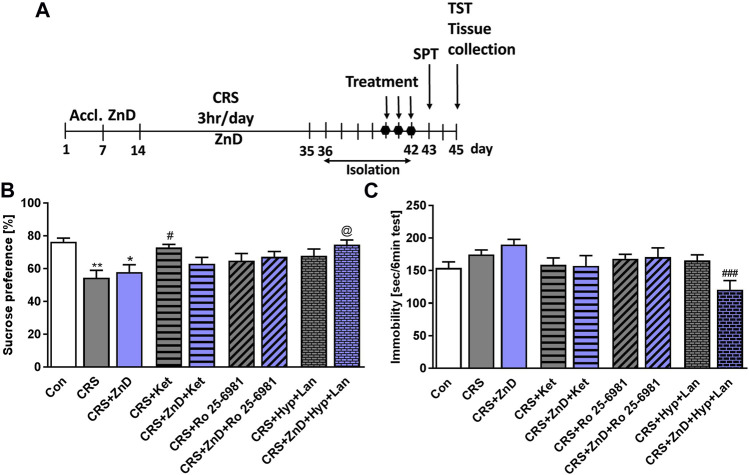
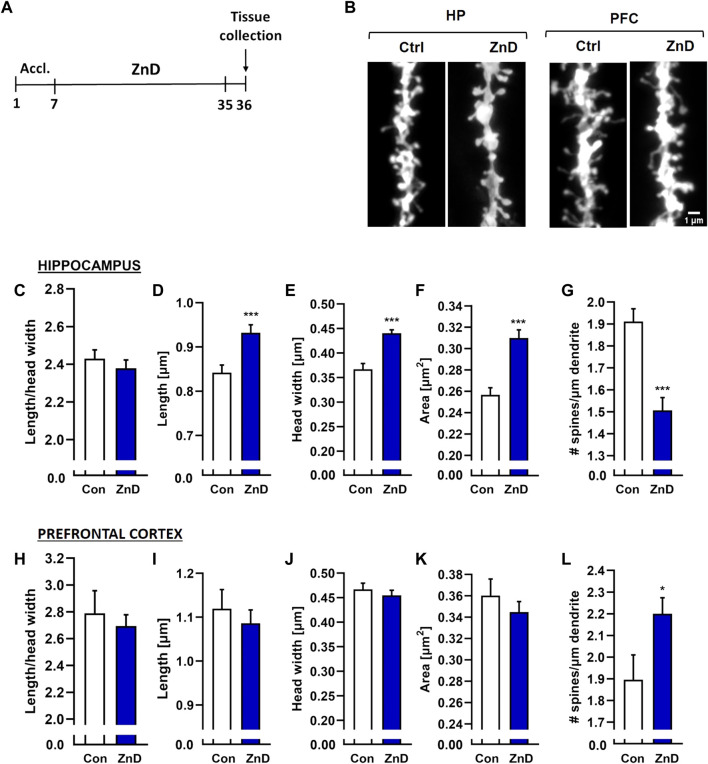
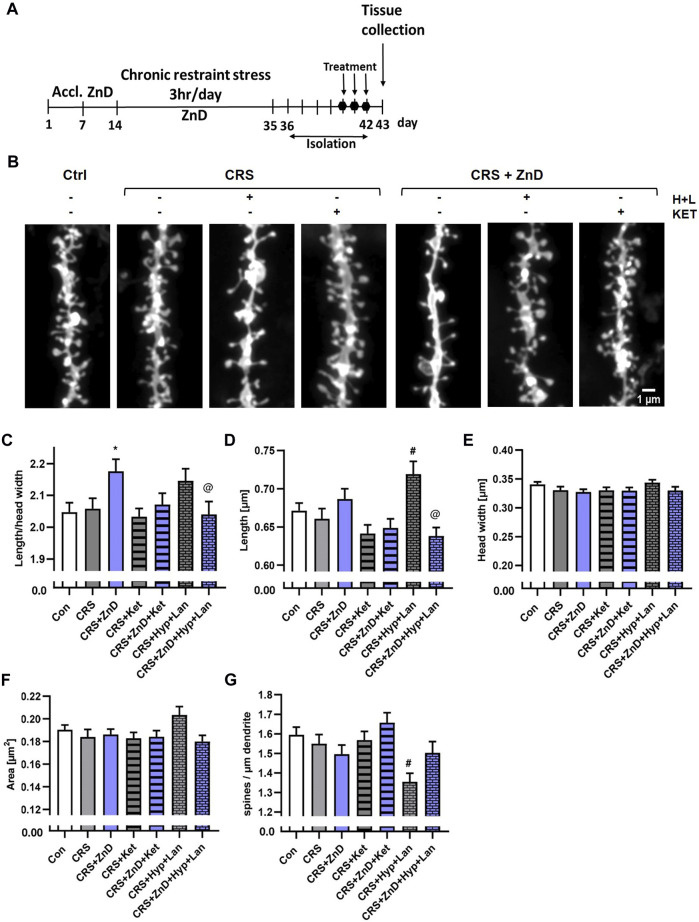
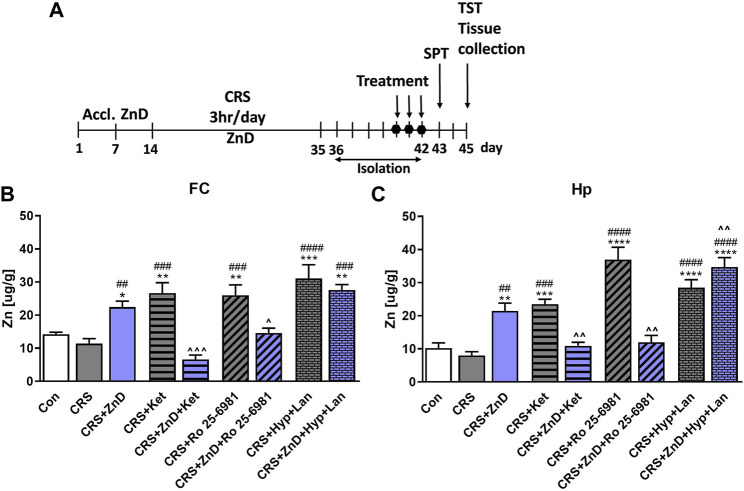
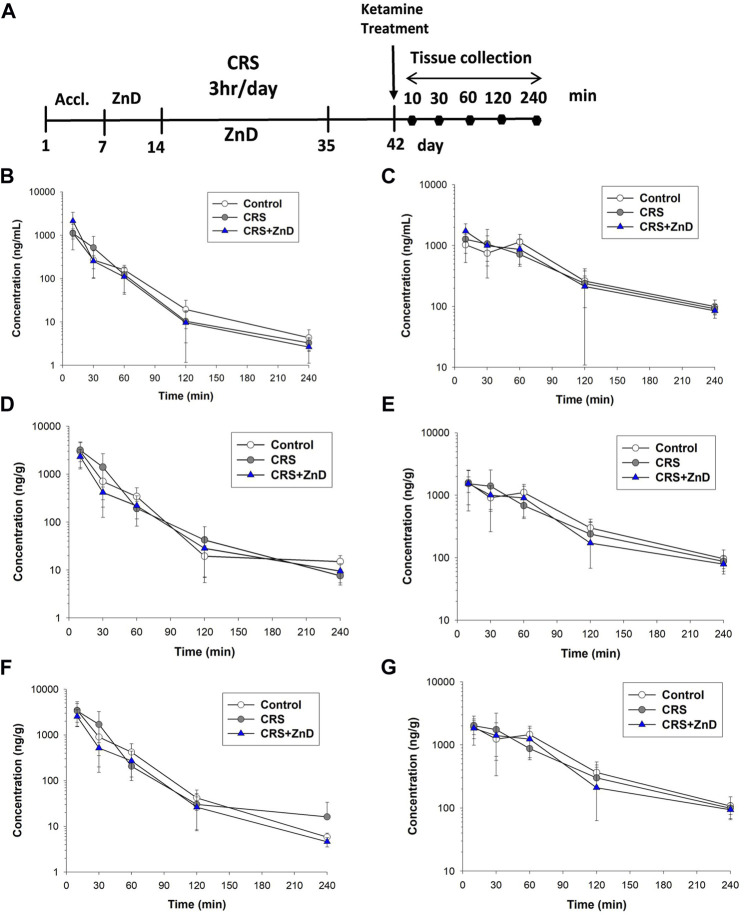
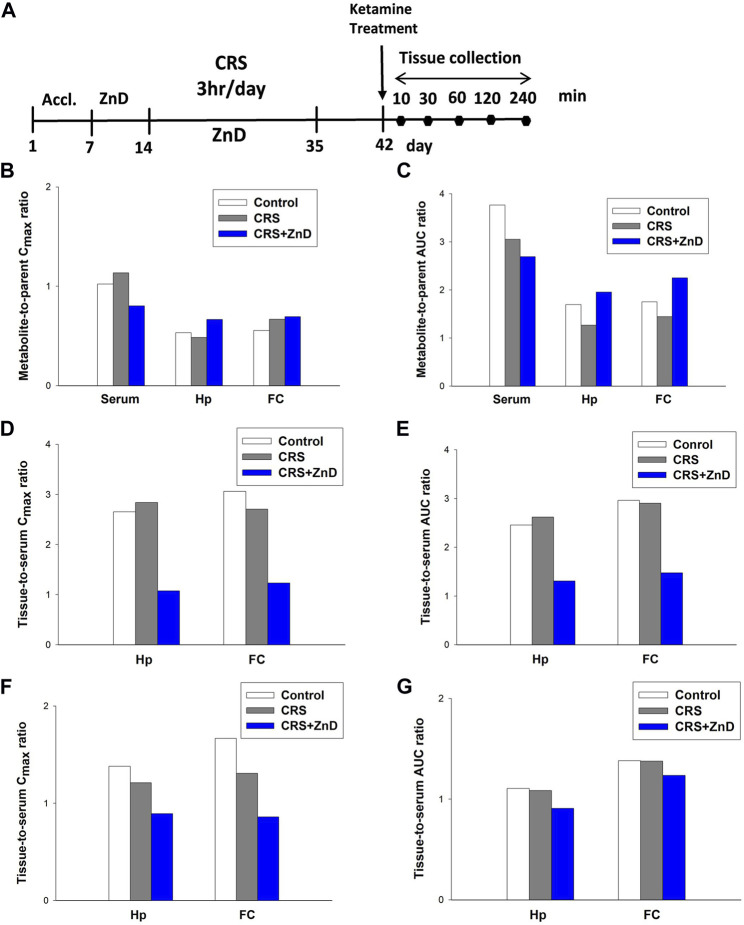
Clinical and preclinical studies show evidence that chronic stress or nutritional deficits in dietary zinc (Zn) intake may be risk factors for developing major depressive disorder (MDD). Furthermore, there may be possible links between low serum Zn levels and development of treatment-resistant depression. In the present work, we combined chronic restraint stress (CRS) and a low-zinc diet (ZnD) in mice and carried out a set of behavioral and biochemical studies. The mice were treated with four different antidepressant compounds, namely, ketamine, Ro 25-6981 (Ro), hyperforin and lanicemine (Hyp + Lan), and imipramine (IMI). We show that CRS or ZnD alone or a combination of CRS and ZnD (CRS + ZnD) induces anhedonia observed in the sucrose preference test (SPT). The behavioral effects of CRS were restored by ketamine or IMI. However, only Hyp + Lan restored the deficits in behavioral phenotype in mice subjected to CRS + ZnD. We also showed that the antidepressant-like effects observed in Hyp + Lan-treated CRS + ZnD mice were associated with changes in the morphology of the dendritic spines (restored physiological level) in the hippocampus (Hp). Finally, we studied the metabolism of ketamine and its brain absorption in CRS and CRS + ZnD mice. Our results suggest that CRS + ZnD does not alter the metabolism of ketamine to (2R,6R;2S,6S)-HNK; however, CRS + ZnD can induce altered bioavailability and distribution of ketamine in the Hp and frontal cortex (FC) in CRS + ZnD animals compared to the control and CRS groups.

Keywords: chronic stress; hyperforin and lanicemine; ketamine; refractory depression; zinc deficiency.


Conflict of interest statement

The authors declare that the research was conducted in the absence of any commercial or financial relationships that could be construed as a potential conflict of interest.

Figures

FIGURE 1
FIGURE 1
Effects of low-Zn diet in the SPT in mice. (A) Experimental schedule. (B) SPT. All values are expressed as mean ± SEM. The data were analyzed by Student’s t-test; N = 10, ***p < 0.001.
FIGURE 2
FIGURE 2
Effects of chronic imipramine treatment in the SPT in mice subjected to CRS and CRS + ZnD. (A) Experimental schedule of drug treatments and behavioral tests. (B) SPT was performed 24 h after the last treatment. All values are expressed as mean ± SEM. The data were analyzed by one-way ANOVA [F (4, 47) = 7,194; p = 0.0001] and Newman–Keuls multiple comparison test, n = 10–11, *p < 0.05 vs. Con; #p < 0.05 vs. CRS. Con: control, CRS: chronic restraint stress, ZnD: zinc deficient diet, IMI: imipramine.
FIGURE 3
FIGURE 3
Effects of Zn-deficient diet and CRS on the antidepressant-like activities of three doses of atypical antidepressant compounds (ketamine: 10 mg/kg, Ro 25–6981: 10 mg/kg, Hyp: 2.5 mg/kg + Lan: 10 mg/kg) in the SPT and TST in mice. (A) Experimental schedule of drug treatments and behavioral tests. (B) SPT was performed 24 h after the last treatment. (C) TST was performed 72 h after the last treatment. All values are expressed as mean ± SEM. The data were analyzed by one-way ANOVA and Newman–Keuls multiple comparison test. (B) F (8, 92) = 3,948; p < 0.0005; *p < 0.05; **p < 0.01 vs. Con, #p < 0.05 vs. CRS, @ p < 0.05 vs. CRS + ZnD, n = 9–12; (C) F (8, 98) = 3,247; p = 0.0025; ### p < 0.001 vs. CRS + ZnD, n = 10–13. Con: control, ZnD: zinc deficient diet, CRS: chronic restraint stress, Hyp: hyperforin, Lan: lanicemine, SPT: sucrose preference test, TST: tail suspension test.
FIGURE 4
FIGURE 4
(A) Experimental schedule. (B) Representative confocal images of DiI-stained dendrite fragments from the hippocampus (Hp) and prefrontal cortex (PFC) of naïve (Con) and zinc-deficient mice. Changes in the shapes and densities of spines in the (C) Hp and (D) PFC in control and ZnD mice. All values are expressed as mean ± SEM. The data were analyzed by Mann–Whitney test [Hp, (C–G)], Student’s t-test with Welch’s correction [PFC, (H)], and Student’s t-test [FC, (I–L)]. [ZnA: morphology: n mice = 4, n dendrites = 66, n spines = 7845; density: n mice = 4, dendrites = 65, total dendrite length = 6334 μm; ZnD: morphology: n mice = 4, n dendrites = 55, n spines = 4489; density: n mice = 4, n dendrites = 57, total dendrite length = 4202 μm]; FC [ZnA: morphology: n mice = 4, n dendrites = 15, n spines = 1204; total dendrite length = 864 μm; ZnD: morphology: n mice = 4, n dendrites = 19, n spines = 1817; density: n mice = 4, dendrites = 20, total dendrite length = 914 μm]. *p < 0.05, ***p < 0.001 vs Con. Con: control, ZnD: zinc defcient diet.
FIGURE 5
FIGURE 5
Effects of three doses of atypical antidepressant compounds (ketamine and Hyp + Lan) on the morphologies and densities of dendritic spines in the Hp in mice subjected to CRS, or CRS + ZnD. (A) Experimental schedule. (B) Representative confocal images of DiI-stained dendrite fragments. Changes in the shape and density of spines in the (C) Hp of mice. All values are expressed as mean ± SEM. The data were analyzed by (C–F) Kruskal–Wallis test followed by Dunn’s multiple comparison test or (G) one-way ANOVA followed by Sidak’s multiple comparison test. * p < 0.05 vs Con, @ p < 0.05 vs CRS + ZnD, # p < 0.05 vs CRS. Hp: [morphology: Con: n mice = 5, n dendrites = 76, n spines = 6286; CRS: n mice = 5, n dendrites = 60, n spines = 4760; CRS + Hyp + Lan: n mice = 4, n dendrites = 44, n spines = 3297; CRS + Ket: n mice = 4, n dendrites = 67, n spines = 5064; CRS + ZnD: n mice = 4, n dendrites = 59, n spines = 4427; CRS + ZnD + Hyp + Lan: n mice = 4, n dendrites = 61, n spines = 4863; CRS + ZnD + Ket: n mice = 3, n dendrites = 60, n spines = 4937; density: Con: n mice = 5, n dendrites = 76, total dendrite length = 5009 μm; CRS: n mice = 5, n dendrites = 60, total dendrite length = 3896 μm; CRS + Hyp + Lan: n mice = 4, n dendrites = 44, total dendrite length = 3010 μm; CRS + Ket: n mice = 4, n dendrites = 67, total dendrite length = 4651 μm; CRS + ZnD: n mice = 4, n dendrites = 59, total dendrite length = 3908 μm; CRS + ZnD + Hyp + Lan: n mice = 4, n dendrites = 59, total dendrite length = 4054 μm; CRS + ZnD + Ket: n mice = 3, n dendrites = 60, total dendrite length = 4040 μm]. Con: control, ZnD: zinc deficient diet, Ket: ketamine, Hyp: hyperforin, Lan: lanicemine.
FIGURE 6
FIGURE 6
Effects of three doses of atypical antidepressant compounds (ketamine: 10 mg/kg, Ro 25–6981: 10 mg/kg; Hyp: 2.5 mg/kg + Lan: 10 mg/kg) on Zn levels in the FC and Hp of mice subjected to CRS and CRS + ZnD. (A) Experimental schedule of drug treatments and behavioral tests. (B) Zn level in the FC and (C) Zn level in the Hp. All values are expressed as mean ± SEM, n = 5–6. The data were analyzed by one-way ANOVA and Newman–Keuls multiple comparison test. FC: [F(8.45) = 13,15; p < 0.0001]; Hp: [F(8.42) = 23.56; p < 0.0001] *p < 0.05, **p < 0.01, ***p < 0.001, ****p < 0.0001 vs. Con; ## p < 0.01, ### p < 0.001, #### p < 0.0001 vs. CRS, ^p < 0.05, ^ ^p < 0.01, ^ ^ ^p < 0.001 vs. CRS + ZnD. Con: control, CRS: chronic restraint stress, Hyp: hyperforin, Ket: ketamine, Lan: lanicemine.
FIGURE 7
FIGURE 7
(A) Experimental schedule of drug treatment. (B,C) Concentration vs. time profiles of ketamine (left panel) and its metabolite hydroxynorketamine (right panel) in mouse serum following intraperitoneal (i.p.) administration of 10 mg/kg ketamine (n = 6). (D,E) Concentration vs. time profiles of ketamine (left panel) and its metabolite hydroxynorketamine (right panel) in mouse hippocampus following i.p. administration of 10 mg/kg ketamine (n = 6). (F,G) Concentration vs. time profiles of ketamine (left panel) and its metabolite hydroxynorketamine (right panel) in mouse frontal cortex following i.p. administration of 10 mg/kg ketamine (n = 6). CRS: chronic restraint stress, ZnD: zinc deficient diet.
FIGURE 8
FIGURE 8
(A) Experimental schedule of drug treatment. (B,C) Metabolite-to-parent ratios of maximum concentrations (Cmax; left panel) and areas under the curves (AUCs; right panel) in the control and study groups. (D,E) Tissue-to-serum ratios of Cmax (left panel) and AUCs (right panel) for ketamine in the control and study groups. (F,G) Tissue-to-serum Cmax (left panel) and AUCs (right panel) for (2R,6R;2S,6S)-HNK in the control and study groups. CRS: chronic restraint stress, FC: frontal cortex, Hp: hippocampus, ZnD: zinc deficient diet.

Similar articles

Cited by

References

    1. Amico-Ruvio S. A., Murthy S. E., Smith T. P., Popescu G. K. (2011). Zinc effects on NMDA receptor gating kinetics. Biophys. J. 100, 1910–1918. 10.1016/j.bpj.2011.02.042 - DOI - PMC - PubMed
    1. Antoniuk S., Bijata M., Ponimaskin E., Wlodarczyk J. (2019). Chronic unpredictable mild stress for modeling depression in rodents: Meta-analysis of model reliability. Neurosci. Biobehav. Rev. 99, 101–116. 10.1016/j.neubiorev.2018.12.002 - DOI - PubMed
    1. Baczynska E., Pels K. K., Basu S., Wlodarczyk J., Ruszczycki B. (2021). Quantification of dendritic spines remodeling under physiological stimuli and in pathological conditions. Int. J. Mol. Sci. 22, 4053. 10.3390/ijms22084053 - DOI - PMC - PubMed
    1. Becking G. C., Morrison A. B. (1970). Hepatic drug metabolism in zinc-deficient rats. Biochem. Pharmacol. 19, 895–902. 10.1016/0006-2952(70)90252-2 - DOI - PubMed
    1. Bijata M., Baczynska E., Muller F. E., Bijata K., Masternak J., Krzystyniak A., et al. (2022). Activation of the 5-HT7 receptor and MMP-9 signaling module in the hippocampal CA1 region is necessary for the development of depressive-like behavior. Cell Rep. 38, 110532. 10.1016/j.celrep.2022.110532 - DOI - PubMed