

Integrated analysis of inflammatory response subtype-related signature to predict clinical outcomes, immune status and drug targets in lower-grade glioma
- PMID: 36091778
- PMCID: PMC9459010
- DOI: 10.3389/fphar.2022.914667
Integrated analysis of inflammatory response subtype-related signature to predict clinical outcomes, immune status and drug targets in lower-grade glioma
Abstract
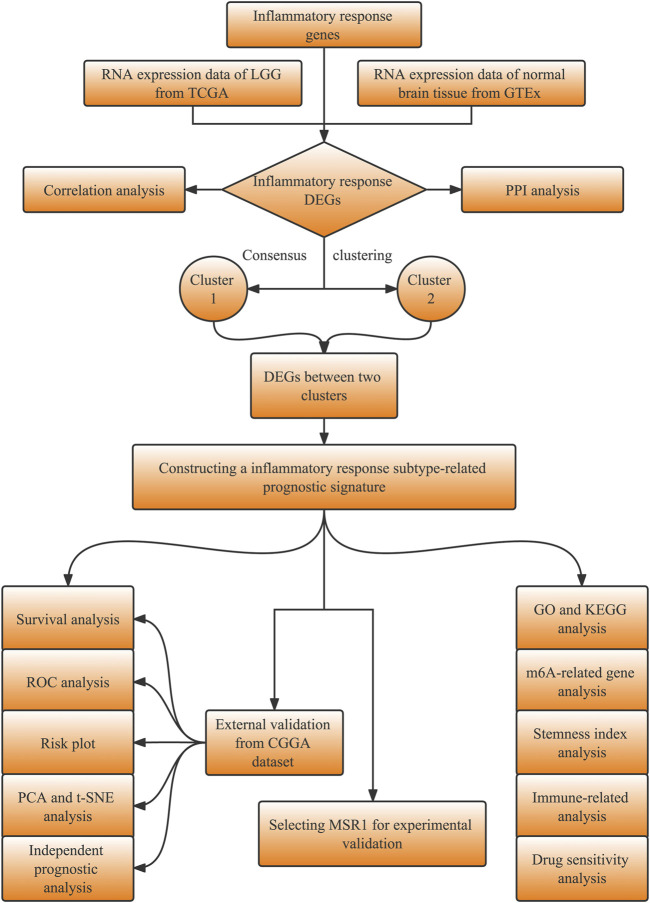
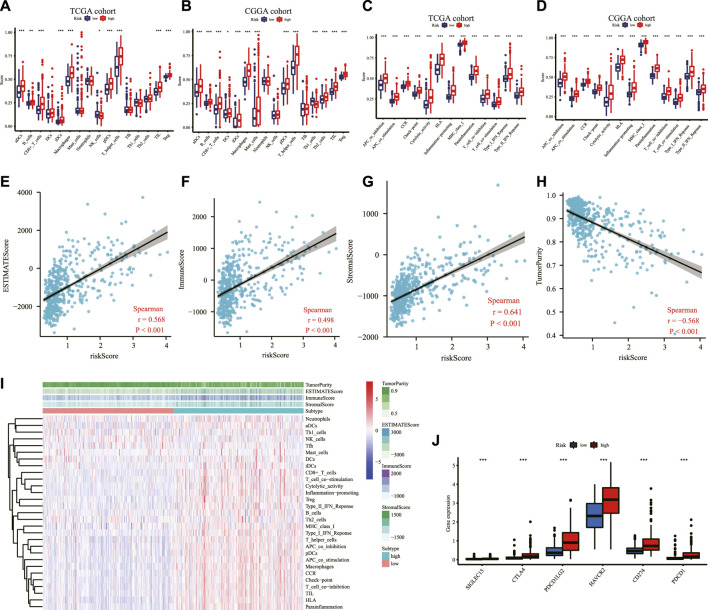
Background: The inflammatory response in the tumor immune microenvironment has implications for the progression and prognosis in glioma. However, few inflammatory response-related biomarkers for lower-grade glioma (LGG) prognosis and immune infiltration have been identified. We aimed to construct and identify the prognostic value of an inflammatory response-related signature, immune infiltration, and drug targets for LGG. Methods: The transcriptomic and clinical data of LGG samples and 200 inflammatory response genes were obtained from public databases. The LGG samples were separated into two inflammatory response-related subtypes based on differentially expressed inflammatory response genes between LGG and normal brain tissue. Next, inflammatory response-related genes (IRRGs) were determined through a difference analysis between the aforementioned two subtypes. An inflammatory response-related prognostic model was constructed using IRRGs by using univariate Cox regression and Lasso regression analyses and validated in an external database (CGGA database). ssGSEA and ESTIMATE algorithms were conducted to evaluate immune infiltration. Additionally, we performed integrated analyses to investigate the correlation between the prognostic signature and N 6-methyladenosine mRNA status, stemness index, and drug sensitivity. We finally selected MSR1 from the prognostic signature for further experimental validation. Results: A total of nine IRRGs were identified to construct the prognostic signature for LGG. LGG patients in the high-risk group presented significantly reduced overall survival than those in the low-risk group. An ROC analysis confirmed the predictive power of the prognostic model. Multivariate analyses identified the risk score as an independent predictor for the overall survival. ssGSEA revealed that the immune status was definitely disparate between two risk subgroups, and immune checkpoints such as PD-1, PD-L1, and CTLA4 were significantly expressed higher in the high-risk group. The risk score was strongly correlated with tumor stemness and m6A. The expression levels of the genes in the signature were significantly associated with the sensitivity of tumor cells to anti-tumor drugs. Finally, the knockdown of MSR1 suppressed LGG cell migration, invasion, epithelial-mesenchymal transition, and proliferation. Conclusion: The study constructed a novel signature composed of nine IRRGs to predict the prognosis, potential drug targets, and impact immune infiltration status in LGG, which hold promise for screening prognostic biomarkers and guiding immunotherapy for LGG.
Keywords: drug targets; immune characteristics; inflammatory response; lower-grade glioma; prognostic signature.
Copyright © 2022 Cao, Zhu, Chen, Huang, Xie, Li, Jiang, Ren and Peng.
Conflict of interest statement
The authors declare that the research was conducted in the absence of any commercial or financial relationships that could be construed as a potential conflict of interest.
Figures


Similar articles
-
Identification of an Inflammatory Response-Related Gene Signature to Predict Survival and Immune Status in Glioma Patients.J Immunol Res. 2022 May 18;2022:8972730. doi: 10.1155/2022/8972730. eCollection 2022. J Immunol Res. 2022. PMID: 35647198 Free PMC article.
-
Identification of Iron Metabolism-Related Genes as Prognostic Indicators for Lower-Grade Glioma.Front Oncol. 2021 Sep 9;11:729103. doi: 10.3389/fonc.2021.729103. eCollection 2021. Front Oncol. 2021. PMID: 34568059 Free PMC article.
-
Novel Immune-Related Gene Signature for Risk Stratification and Prognosis of Survival in Lower-Grade Glioma.Front Genet. 2020 Apr 15;11:363. doi: 10.3389/fgene.2020.00363. eCollection 2020. Front Genet. 2020. PMID: 32351547 Free PMC article.
-
Identification of a novel cuproptosis-related gene signature and integrative analyses in patients with lower-grade gliomas.Front Immunol. 2022 Aug 15;13:933973. doi: 10.3389/fimmu.2022.933973. eCollection 2022. Front Immunol. 2022. PMID: 36045691 Free PMC article. Review.
-
Molecular subtypes based on PANoptosis-related genes and tumor microenvironment infiltration characteristics in lower-grade glioma.Funct Integr Genomics. 2023 Mar 17;23(2):84. doi: 10.1007/s10142-023-01003-5. Funct Integr Genomics. 2023. Retraction in: Funct Integr Genomics. 2024 May 11;24(3):88. doi: 10.1007/s10142-024-01374-3. PMID: 36930242 Retracted. Review.
Cited by
-
GADD45B regulates the carcinogenesis process of chronic atrophic gastritis and the metabolic pathways of gastric cancer.Front Endocrinol (Lausanne). 2023 Aug 7;14:1224832. doi: 10.3389/fendo.2023.1224832. eCollection 2023. Front Endocrinol (Lausanne). 2023. PMID: 37608794 Free PMC article.
-
Classification related to immunogenic cell death predicts prognosis, immune microenvironment characteristics, and response to immunotherapy in lower-grade gliomas.Front Immunol. 2023 Apr 19;14:1102094. doi: 10.3389/fimmu.2023.1102094. eCollection 2023. Front Immunol. 2023. PMID: 37153540 Free PMC article.
-
Biomarker identification associated with M2 tumor-associated macrophage infiltration in glioblastoma.Front Neurol. 2025 May 14;16:1545608. doi: 10.3389/fneur.2025.1545608. eCollection 2025. Front Neurol. 2025. PMID: 40438577 Free PMC article.
-
Glutathione metabolism-related gene signature predicts prognosis and treatment response in low-grade glioma.Aging (Albany NY). 2024 May 30;16(11):9518-9546. doi: 10.18632/aging.205881. Epub 2024 May 30. Aging (Albany NY). 2024. PMID: 38819225 Free PMC article.
-
Immunoregulatory functions and therapeutic potential of natural killer cell-derived extracellular vesicles in chronic diseases.Front Immunol. 2024 Jan 3;14:1328094. doi: 10.3389/fimmu.2023.1328094. eCollection 2023. Front Immunol. 2024. PMID: 38239346 Free PMC article. Review.
References
LinkOut - more resources
Full Text Sources
Research Materials