. 2022 Aug 26:13:928226.
doi: 10.3389/fphar.2022.928226. eCollection 2022.

Loss of MHC-I antigen presentation correlated with immune checkpoint blockade tolerance in MAPK inhibitor-resistant melanoma

Affiliations

Loss of MHC-I antigen presentation correlated with immune checkpoint blockade tolerance in MAPK inhibitor-resistant melanoma

Jing Yu et al. Front Pharmacol. .

Abstract

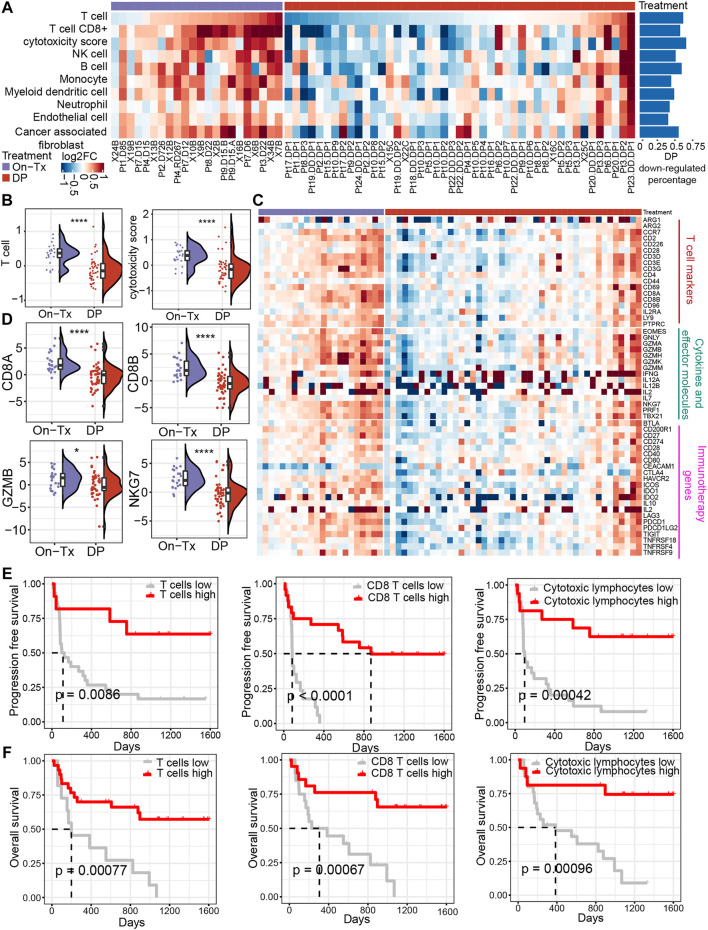
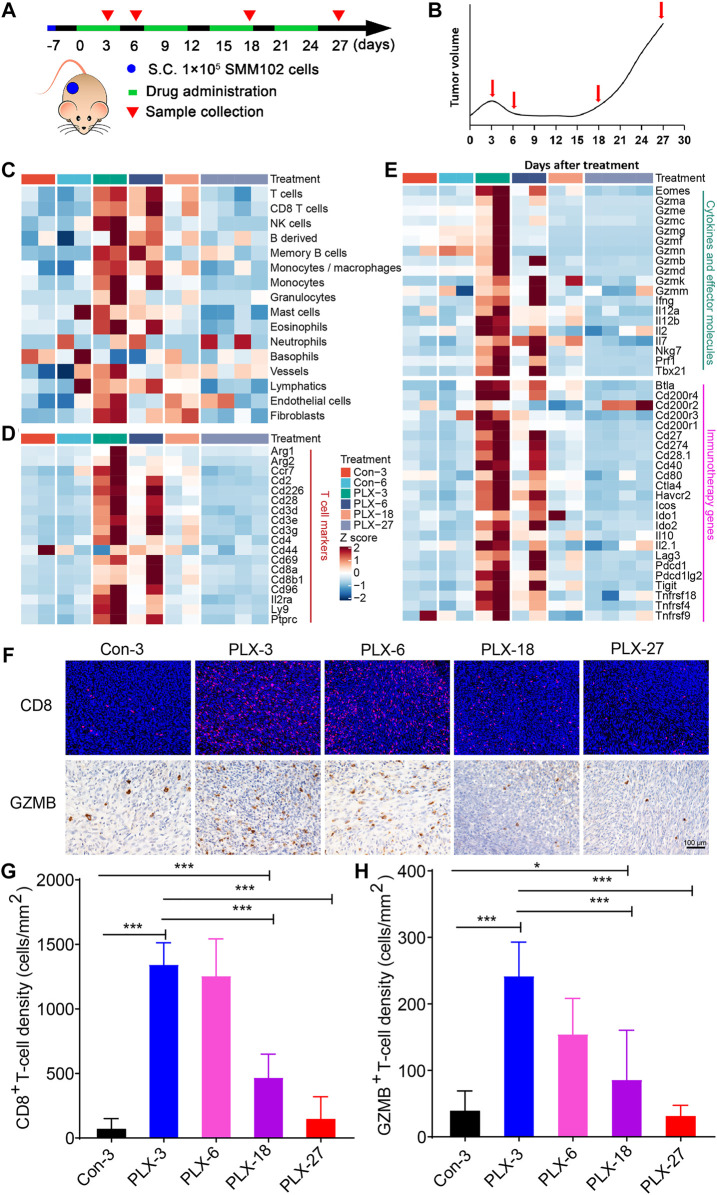
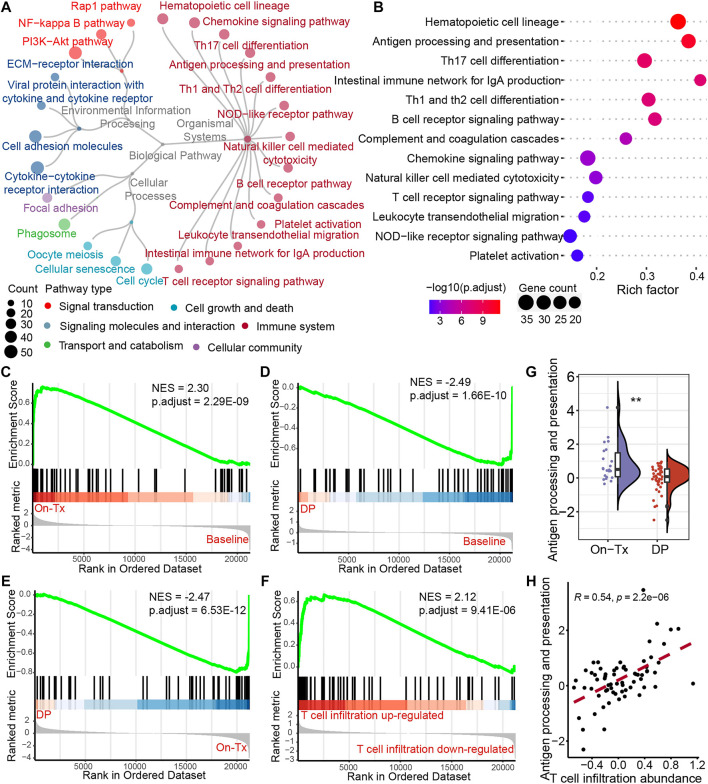
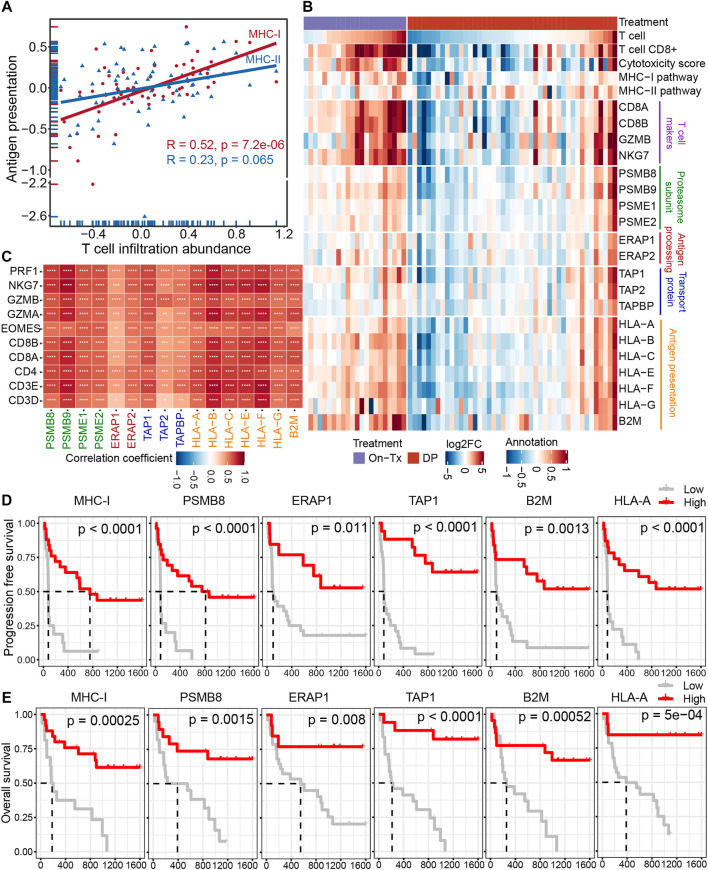
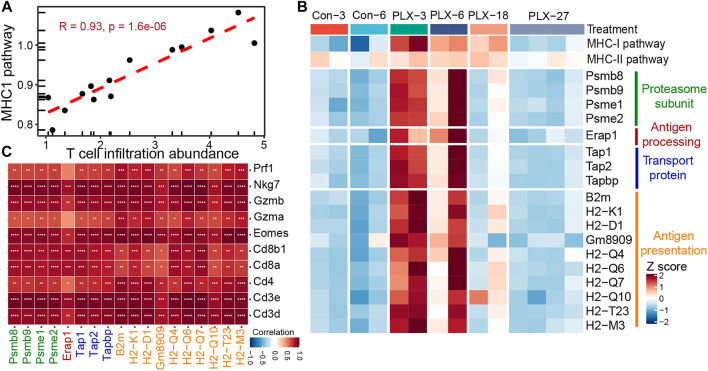
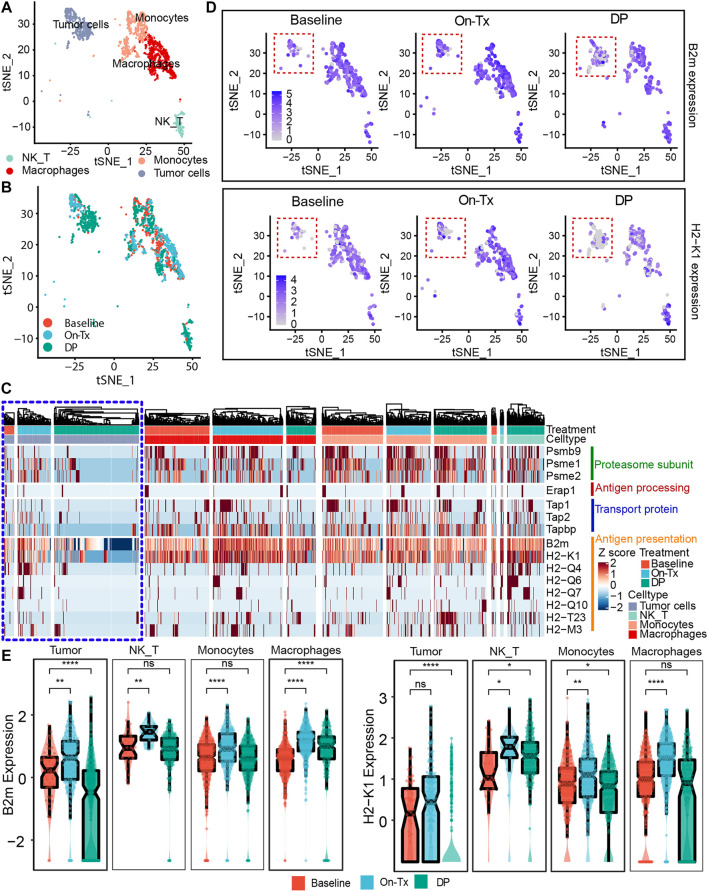
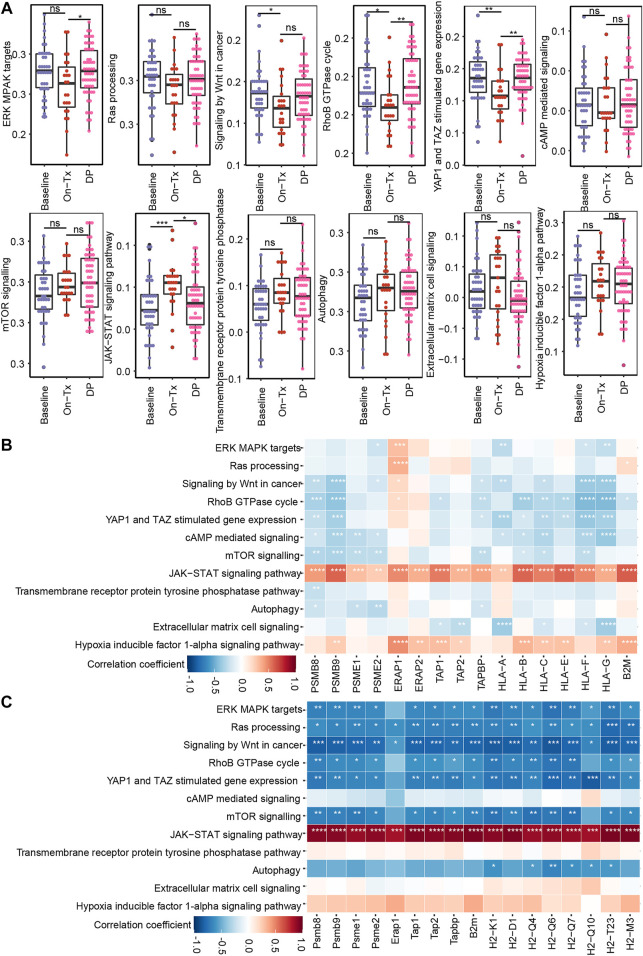
Immune checkpoint blockade and MAPK-targeted combined therapy is a promising regimen for advanced melanoma patients. However, the clinical benefit from this combo regimen remains limited, especially in patients who acquired resistance to MAPK-targeted therapy. Here, we systematically characterized the immune landscape during MAPK-targeted therapy in patients and mouse melanoma models. We observed that both the abundance of tumor-infiltrated T cells and the expression of immune-related genes were upregulated in the drug-responsive period, but downregulated in the resistance period, implying that acquired drug resistance dampens the antitumor immune response. Further transcriptomic dissection indicated that loss of MHC-I antigen presentation on tumor cells plays a critical role in the reduction of T cell infiltration during drug resistance. Survival analysis demonstrates that loss of antigen presentation and reduction of T-cell infiltration during acquired drug resistance are associated with poorer clinical response and prognosis of anti-PD-1 therapy in melanoma patients. In addition, we identified that alterations in the MAPK inhibitor resistance-related oncogenic signaling pathway closely correlated with deficiency of MHC-I antigen presentation, including activation of the PI3K-mTOR, MAPK, and Wnt pathways. In conclusion, our research illuminates that decreased infiltration of T cells is associated with acquired drug resistance during MAPK-targeted therapy, which may underlie the cross-resistance to immune checkpoint blockade.

Keywords: MAPK-targeted therapy; MHC-I antigen presentation; drug resistance (DR); immune checkpoint blockade; melanoma; tumor immune microenvironment.


Conflict of interest statement

The authors declare that the research was conducted in the absence of any commercial or financial relationships that could be construed as a potential conflict of interest.

Figures

FIGURE 1
FIGURE 1
Dynamic changes in the immune microenvironment during MAPK-targeted therapy in melanoma. (A) Heatmap of log2FC expression in tumor-infiltrating immune cells and stromal cells between MAPKi-treated and patient-matched baseline biopsies (GSE75313, GSE65185, and EGAS00001000992). The rows have been sorted according to the log2FC of the T cell. The right histogram shows the proportion of samples with downregulated infiltrating cell abundance in the resistant biopsies compared to the baseline biopsies (B) Boxplot showing differences in log2FC expression of T cell and cytotoxicity scores between on-treatment and resistance biopsies. The log2FC was obtained by comparison with patient-matched baseline biopsy samples. Statistical analysis was performed using the Wilcoxon test. (C) The heatmap shows the changes in the expression of T cell marker genes, cytokines and effector molecule genes, and immunotherapy-related genes in the treated biopsies relative to baseline biopsies during MAPKi treatment. The order of the rows is consistent with that shown in (A). (D) Boxplot showing differences in log2FC expression of CD8A, CD8B, GZMB, and NKG7 between on-treatment and resistance biopsies. The log2FC was obtained by comparison with patient-matched baseline biopsy samples. Statistical analysis was performed using the Wilcoxon test. (E) Kaplan-Meier plots showing progression-free survival (PFS) of anti-PD1 treated melanoma patients, stratified by using the optimal cutoffs for T cell, CD8+ T cell, and cytotoxic lymphocyte infiltrating abundance (PRJEB23709). The optimal cutoff is defined as the point with the smallest p-value (log-rank test) split. (F) Kaplan-Meier plots showing overall survival (OS) of anti-PD1 treated melanoma patients, stratified by using the optimal cutoffs for T cell, CD8+ T cell, and cytotoxic lymphocyte infiltrating abundance (PRJEB23709). The optimal cutoff is defined as the point with the smallest p-value (log-rank test) split. ∗p < 0.05; ∗∗p < 0.01; ∗∗p < 0.001; *∗∗∗p < 0.0001. On-Tx: biopsies on-treatment of MAPKi; DP: biopsies resistant with MAPKi.
FIGURE 2
FIGURE 2
Dynamic changes in immune signatures during BRAFi treatment in the mouse melanoma models. (A) Schematic representation of the experimental design used for the mouse melanoma model with or without BRAFi treatment. On day -7, 1 × 10^5 SMM102 tumor cells were inoculated on the backs of C57BL/6 mice, and the tumor-bearing mice were treated with saline (control), or vemurafenib (PLX4032) for the corresponding times and analyzed at the indicated time points (day 3, 6, 18, and 27). (B) The resistance curve model of SMM102 tumor to vemurafenib. (C) Dynamic changes in tumor-infiltrating lymphocyte and stromal cell abundance at different time points of BRAFi treatment in the mouse melanoma models (GSE161430). (D,E) Heatmap showing changes in the expression levels of T cell marker genes, cytokines and effector molecule genes, and immunotherapy target genes at different times of BRAFi treatment in the mouse melanoma model. (F) Anti-CD8 immunofluorescence and anti-GZMB immunohistochemistry staining of BRAFi-treated mouse melanoma tissues. (G,H) Quantification of CD8+ cells and GZMB+ cells. The results are presented as the mean ± SD (n = 5), and statistical tests were performed using one-way ANOVA. ∗p < 0.05; ∗∗p < 0.01; ∗∗∗p < 0.001; ∗∗∗∗p < 0.0001.
FIGURE 3
FIGURE 3
Potential regulatory pathways of T-cell infiltration during MAPK-targeted therapy. (A) The circular dendrogram shows the KEGG pathways that were significantly enriched (adjusted p-value < 0.05) for functional annotation using differentially expressed genes between On-Tx and DP biopsies (GSE75313, GSE65185, and EGAS00001000992). (B) The figure shows all the pathways belonging to the immune system in (A). (C–E) Gene Set Enrichment Analysis (GSEA) showing antigen processing and presentation pathway activity at different stages of MAPK-targeted therapy, (C) between On-Tx and Baseline biopsies (D) between DP and Baseline biopsies, (E) between DP and On-Tx biopsies. (F) GSEA showing antigen processing and presentation pathway activity between resistance biopsies with up- and downregulated T cell infiltration abundance relative to baseline biopsies. (G) Boxplot showing differences in log2FC expression of antigen processing and presentation pathway between on-treatment and drug-resistance biopsies. The log2FC was obtained by comparison with patient-matched baseline biopsy samples. Statistical analysis was performed using the Wilcoxon test. (H) Scatter plot showing Pearson’s correlation between antigen processing and presentation pathway and abundance of T cell infiltration. The value used to calculate the correlation was log2FC expression between MAPKi-treated and patient-matched baseline biopsies. ∗∗p < 0.01. NES normalized enrichment score.
FIGURE 4
FIGURE 4
Decreased infiltration of T cells was regulated by MHC-I antigen presentation during MAPK-targeted therapy. (A) Pearson’s correlations between MHC class I (MHC-I) and MHC class II (MHC-II) antigen processing and presentation pathways and abundance of T cell infiltration were calculated, respectively (GSE75313, GSE65185, and EGAS00001000992). The value used to calculate the correlation was log2FC expression between MAPKi-treated and baseline biopsies. (B) Heatmap showing log2FC expression changes of T cell marker genes and genes involved in the four steps of MHC-I antigen processing and presentation pathway during treatment relative to before MAPKi treatment. (C) The tileplot shows the Pearson’s correlation of log2FC values between MHC-I molecules and T cell marker genes during MAPKi treatment. The log2FC was obtained by comparison with patient-matched baseline biopsy samples. (D) Kaplan-Meier plots showing the PFS of anti-PD1 treated melanoma patients, stratified by using the optimal cutoffs for the activity of MHC-I antigen presentation pathway and the expression of MHC-I molecules including PSMB8, ERAP1, TAP1, HLA-A, and B2M. Statistical tests were performed using log-rank test (PRJEB23709). (E) Kaplan-Meier plots showing the OS of anti-PD1 treated melanoma patients, stratified by using the optimal cutoffs for the activity of MHC-I antigen presentation pathway and the expression of MHC-I molecules including PSMB8, ERAP1, TAP1, HLA-A, and B2M. Statistical tests were performed using log-rank test (PRJEB23709). ∗p < 0.05; ∗∗p < 0.01; ∗∗∗p < 0.001; ∗∗∗∗p < 0.0001.
FIGURE 5
FIGURE 5
Correlation between MHC-I molecules and T cell infiltration in the mouse melanoma models. (A) Scatterplot showing Pearson’s correlation between MHC-I antigen processing and presentation pathways and abundance of T cell infiltration in the mouse melanoma models (GSE161430). (B) Heatmap showing the expression changes of MHC-I molecules at different times of BRAFi treatment in the mouse melanoma models. (C) Pearson’s correlations between MHC-I molecules and T cell marker genes were calculated based on the transcriptome data of the mouse melanoma models. ∗p < 0.05; ∗∗p < 0.01; ∗∗∗p < 0.001; ∗∗∗p < 0.0001.
FIGURE 6
FIGURE 6
Expression of MHC-I molecules in different cell types. (A) t-SNE plot showing mouse single cells at different stages of the BRAFi response. Different colors indicate different cell types (GSE126714). (B) t-SNE plot showing mouse single cells at different stages of the BRAFi response. Different colors indicate different stages of BRAFi processing. (C) Heatmap showing the expression changes of MHC-I molecules in tumor cells (purple box marker), T/NK cells, macrophages, and monocytes at different stages of the BRAFi response. (D) Single-cell RNA-seq featurplot showing the expression of B2M and H2-K1 in baseline, On-Tx, and DP cells. Tumor cells are marked by red dotted boxes. (E) Single-cell RNA-seq boxplot showing the expression of B2M and H2-K1 in tumor cells, T/NK cells, macrophages, and monocytes at different stages of BRAFi response. Statistical analysis was performed using the Wilcoxon test. Baseline: cells before BRAFi; On-Tx: cells on-treatment of BRAFi; DP: cells resistant to BRAFi. ∗p < 0.05; ∗∗p < 0.01; ∗∗∗p < 0.001; ∗∗∗∗p < 0.0001.
FIGURE 7
FIGURE 7
Correlation between MHC-I molecules and MAPK-targeted therapy resistance-related pathways. (A) Boxplot shows the activation levels of MAPKi resistance-related signaling pathways in clinical samples at different stages of targeted therapy (GSE75313, GSE65185, and EGAS00001000992). Statistical analysis was performed using the Wilcoxon test. ns p > 0.05; ∗p < 0.05; ∗∗p < 0.01; ∗∗∗p < 0.001; ∗∗∗∗p < 0.0001. (B) Heatmap showing Pearson’s correlations between MHC-I molecules and MAPKi resistance-related pathways in melanoma biopsy data (GSE75313, GSE65185, and EGAS00001000992). (C) Heatmap showing Pearson’s correlations between MHC-I molecules and MAPKi resistance-related pathways in the melanoma mouse models (GSE161430). ∗p < 0.05; ∗∗p < 0.01; ∗∗∗p < 0.001; ∗∗∗∗p < 0.0001.

Similar articles

Cited by

References

    1. Amini-Adle M., Khanafer N., Le-Bouar M., Duru G., Dalle S., Thomas L. (2018). Ineffective anti PD-1 therapy after BRAF inhibitor failure in advanced melanoma. BMC Cancer 18 (1), 705. 10.1186/s12885-018-4618-9 - DOI - PMC - PubMed
    1. Ascierto P. A., Kirkwood J. M., Grob J. J., Simeone E., Grimaldi A. M., Maio M., et al. (2012). The role of BRAF V600 mutation in melanoma. J. Transl. Med. 10, 85. 10.1186/1479-5876-10-85 - DOI - PMC - PubMed
    1. Bai X., Wang X., Ma G., Song J., Liu X., Wu X., et al. (2021). Improvement of PD-1 blockade efficacy and elimination of immune-related gastrointestinal adverse effect by mTOR inhibitor. Front. Immunol. 12, 793831. 10.3389/fimmu.2021.793831 - DOI - PMC - PubMed
    1. Becht E., Giraldo N. A., Lacroix L., Buttard B., Elarouci N., Petitprez F., et al. (2016). Estimating the population abundance of tissue-infiltrating immune and stromal cell populations using gene expression. Genome Biol. 17 (1), 218. 10.1186/s13059-016-1070-5 - DOI - PMC - PubMed
    1. Bhalla S., Evens A. M., Dai B., Prachand S., Gordon L. I., Gartenhaus R. B. (2011). The novel anti-MEK small molecule AZD6244 induces BIM-dependent and AKT-independent apoptosis in diffuse large B-cell lymphoma. Blood 118 (4), 1052–1061. 10.1182/blood-2011-03-340109 - DOI - PMC - PubMed