Qingfei Jiedu decoction inhibits PD-L1 expression in lung adenocarcinoma based on network pharmacology analysis, molecular docking and experimental verification
- PMID: 36091822
- PMCID: PMC9454399
- DOI: 10.3389/fphar.2022.897966
Qingfei Jiedu decoction inhibits PD-L1 expression in lung adenocarcinoma based on network pharmacology analysis, molecular docking and experimental verification
Abstract
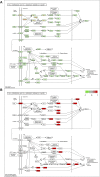
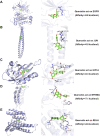
Objective: We aim at investigating the molecular mechanisms through which the Qingfei Jiedu decoction (QFJDD) regulates PD-L1 expression in lung adenocarcinoma (LUAD). Methods: Bioactive compounds and targets of QFJDD were screened from TCMSP, BATMAN-TCM, and literature. Then, GeneCard, OMIM, PharmGKB, Therapeutic Target, and DrugBank databases were used to identify LUAD-related genes. The protein-protein interaction (PPI) network was constructed using overlapping targets of bioactive compounds in LUAD with the Cytoscape software and STRING database. The potential functions and pathways in which the hub genes were enriched by GO, KEGG, and DAVID pathway analyses. Molecular docking of bioactive compounds and key genes was executed via AutoDock Vina. Qualitative and quantitative analyses of QFJDD were performed using UPLC-Q-TOF-MS and UPLC. Expressions of key genes were determined by qRT-PCR, immunoreactivity score (IRS) of PD-L1 was assessed by immunohistochemistry (IHC), while the CD8+PD-1+T% derived from spleen tissues of Lewis lung cancer (LLC) bearing-mice was calculated using flow cytometry (FCM). Results: A total of 53 bioactive compounds and 288 targets of QFJDD as well as 8151 LUAD associated genes were obtained. Further, six bioactive compounds, including quercetin, luteolin, kaempferol, wogonin, baicalein, and acacetin, and 22 hub genes were identified. The GO analysis showed that the hub genes were mainly enriched in DNA or RNA transcription. KEGG and DAVID pathway analyses revealed that 20 hub genes were primarily enriched in virus, cancer, immune, endocrine, and cardiovascular pathways. The EGFR, JUN, RELA, HIF1A, NFKBIA, AKT1, MAPK1, and MAPK14 hub genes were identified as key genes in PD-L1 expression and PD-1 checkpoint pathway. Moreover, ideal affinity and regions were identified between core compounds and key genes. Notably, QFJDD downregulated EGFR, JUN, RELA, HIF1A, NFKBIA, and CD274 expressions (p < 0.05), while it upregulated AKT1 and MAPK1 (p < 0.05) levels in A549 cells. The PD-L1 IRS of LLC tissue in the QFJDD high dose (Hd) group was lower than model group (p < 0.01). CD8+PD-1+T% was higher in the QFJDD Hd group than in normal and model groups (p < 0.05). Conclusion: QFJDD downregulates PD-L1 expression and increases CD8+PD-1+T% via regulating HIF-1, EGFR, JUN and NFκB signaling pathways. Therefore, QFJDD is a potential treatment option for LUAD.
Keywords: CD8+PD-1+T; Qingfei Jiedu decoction; lung adenocarcinoma; molecular docking; network pharmacology; programmed cell death ligand-1.
Copyright © 2022 Pan, Yang, Zhu, Lou and Jin.
Conflict of interest statement
The authors declare that the research was conducted in the absence of any commercial or financial relationships that could be construed as a potential conflict of interest.
Figures


Similar articles
-
[Mechanism of Mahuang Lianqiao Chixiaodou Decoction in treating eczema by network pharmacology and molecular docking technology].Zhongguo Zhong Yao Za Zhi. 2021 Feb;46(4):894-901. doi: 10.19540/j.cnki.cjcmm.20201117.401. Zhongguo Zhong Yao Za Zhi. 2021. PMID: 33645094 Chinese.
-
Network Pharmacology and Molecular Docking on the Molecular Mechanism of Jiawei-Huang Lian-Gan Jiang Decoction in the Treatment of Colorectal Adenomas.Evid Based Complement Alternat Med. 2022 Jul 18;2022:8211941. doi: 10.1155/2022/8211941. eCollection 2022. Evid Based Complement Alternat Med. 2022. PMID: 35899228 Free PMC article.
-
Network pharmacology and molecular docking analysis reveal insights into the molecular mechanism of shiliao decoction in the treatment of cancer-associated malnutrition.Front Nutr. 2022 Aug 25;9:985991. doi: 10.3389/fnut.2022.985991. eCollection 2022. Front Nutr. 2022. PMID: 36091226 Free PMC article.
-
Network pharmacology prediction and molecular docking-based strategy to explore the potential mechanism of Huanglian Jiedu Decoction against sepsis.Comput Biol Med. 2022 May;144:105389. doi: 10.1016/j.compbiomed.2022.105389. Epub 2022 Mar 9. Comput Biol Med. 2022. PMID: 35303581 Review.
-
Exploration of the mechanism of Zisheng Shenqi decoction against gout arthritis using network pharmacology.Comput Biol Chem. 2021 Feb;90:107358. doi: 10.1016/j.compbiolchem.2020.107358. Epub 2020 Aug 8. Comput Biol Chem. 2021. PMID: 33243703 Review.
Cited by
-
Computational Approaches Drive Developments in Immune-Oncology Therapies for PD-1/PD-L1 Immune Checkpoint Inhibitors.Int J Mol Sci. 2023 Mar 21;24(6):5908. doi: 10.3390/ijms24065908. Int J Mol Sci. 2023. PMID: 36982981 Free PMC article. Review.
-
Proteomic analysis reveals LRPAP1 as a key player in the micropapillary pattern metastasis of lung adenocarcinoma.Heliyon. 2023 Dec 20;10(1):e23913. doi: 10.1016/j.heliyon.2023.e23913. eCollection 2024 Jan 15. Heliyon. 2023. PMID: 38226250 Free PMC article.
-
Traditional Chinese medicine inhibits PD-1/PD-L1 axis to sensitize cancer immunotherapy: a literature review.Front Oncol. 2023 Jun 16;13:1168226. doi: 10.3389/fonc.2023.1168226. eCollection 2023. Front Oncol. 2023. PMID: 37397393 Free PMC article. Review.
-
Traditional Chinese medicine in the prevention and treatment of lung cancer metastasis by regulating tumor-associated macrophages: a narrative review.Transl Lung Cancer Res. 2025 Jun 30;14(6):2281-2295. doi: 10.21037/tlcr-2025-380. Epub 2025 Jun 26. Transl Lung Cancer Res. 2025. PMID: 40673085 Free PMC article. Review.
-
Traditional Chinese medicine and its components effectively reduce resistance mediated by immune checkpoint inhibitors.Front Immunol. 2024 Nov 26;15:1429483. doi: 10.3389/fimmu.2024.1429483. eCollection 2024. Front Immunol. 2024. PMID: 39660124 Free PMC article. Review.
References
LinkOut - more resources
Full Text Sources
Research Materials
Miscellaneous

