

Chromosome 3A harbors several pleiotropic and stable drought-responsive alleles for photosynthetic efficiency selected through wheat breeding
- PMID: 36091876
- PMCID: PMC9440346
- DOI: 10.1002/pld3.438
Chromosome 3A harbors several pleiotropic and stable drought-responsive alleles for photosynthetic efficiency selected through wheat breeding
Abstract
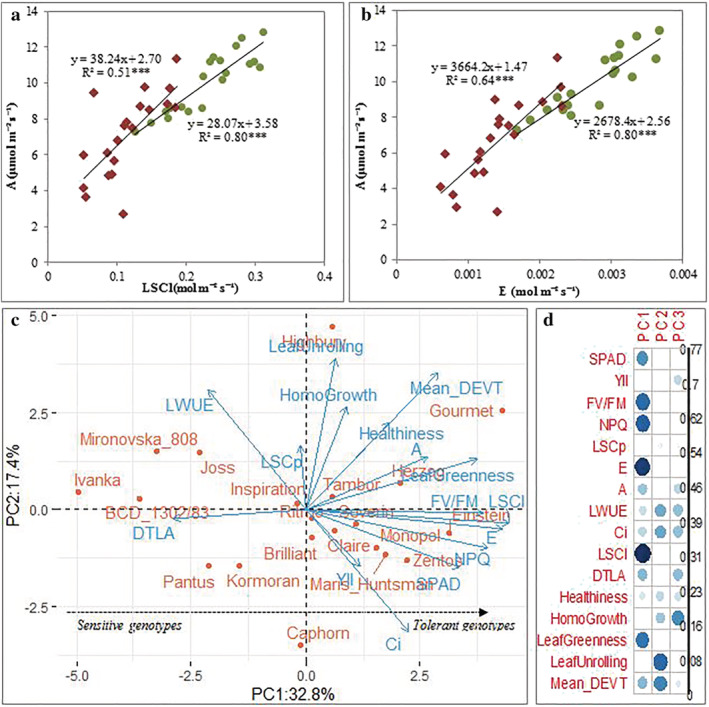
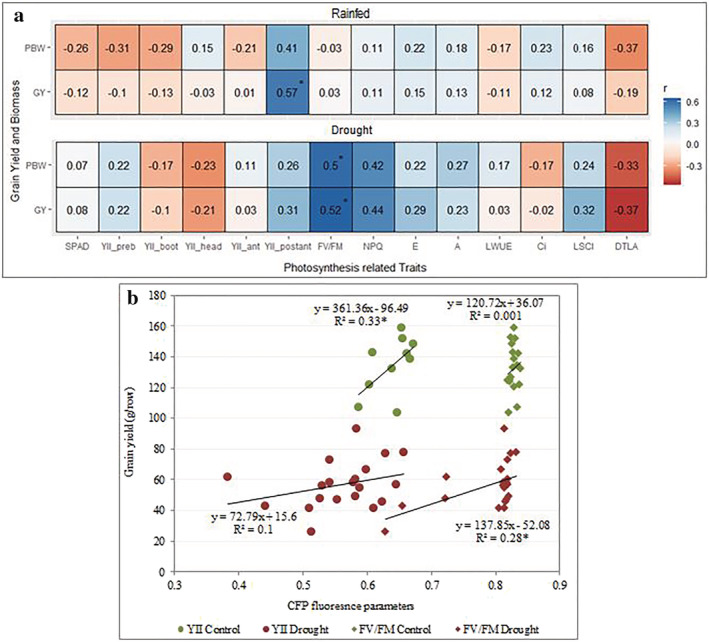
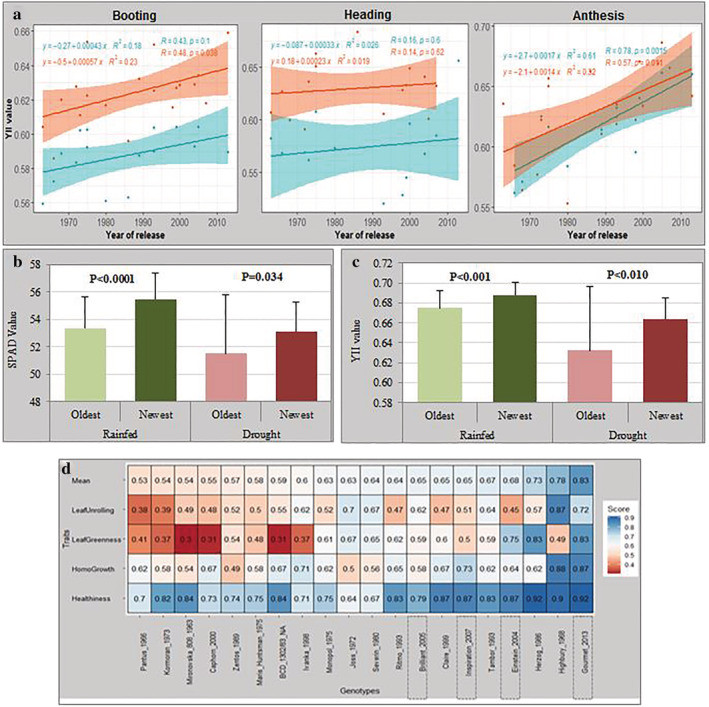
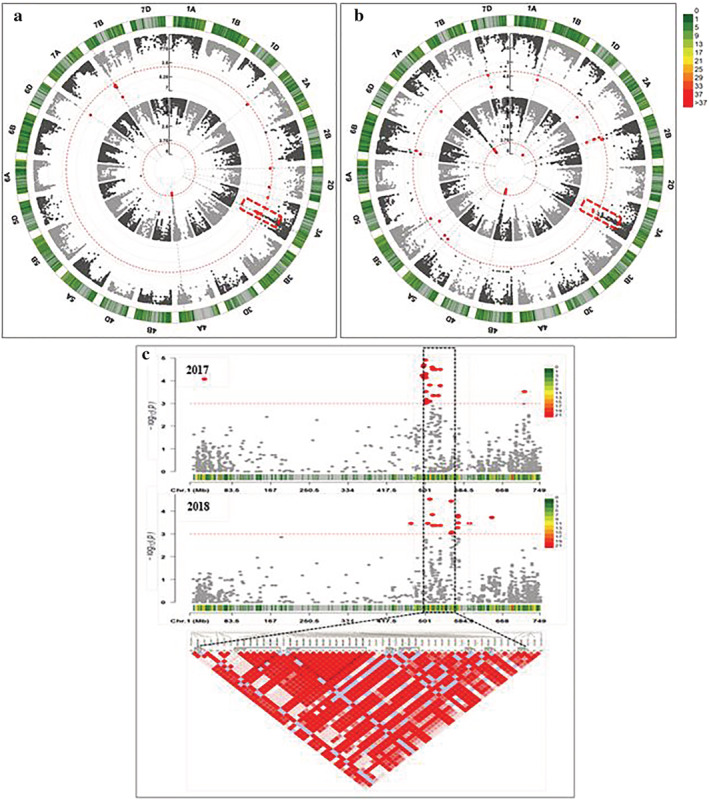
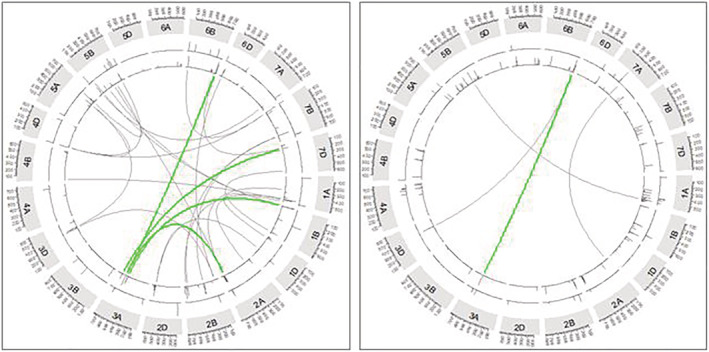
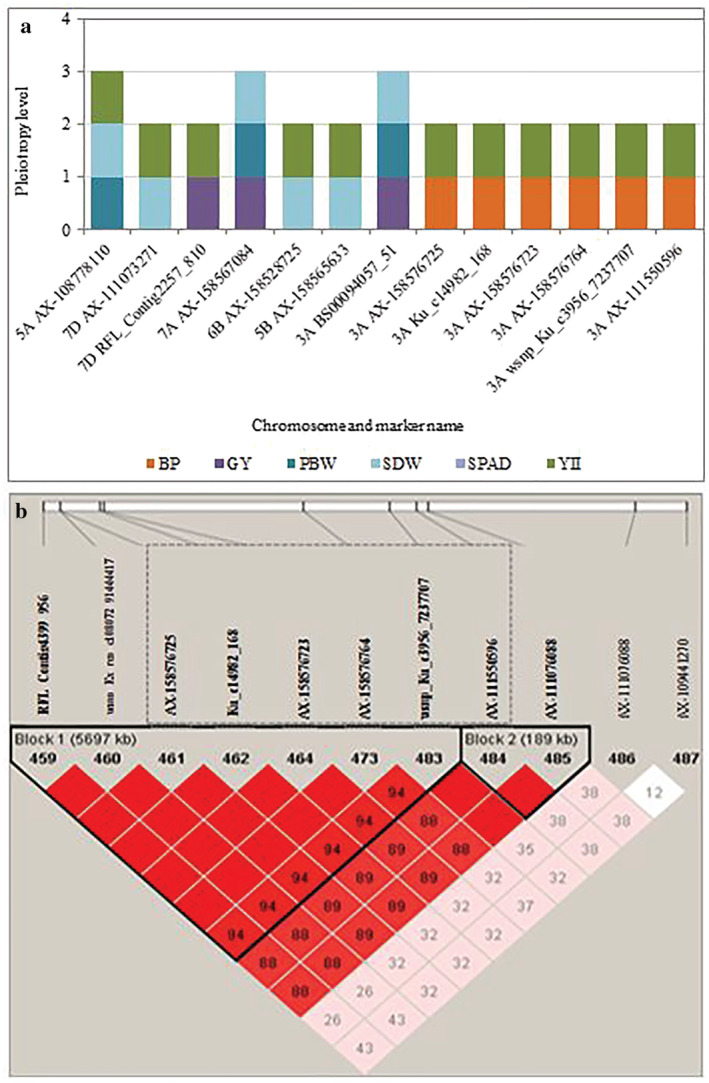
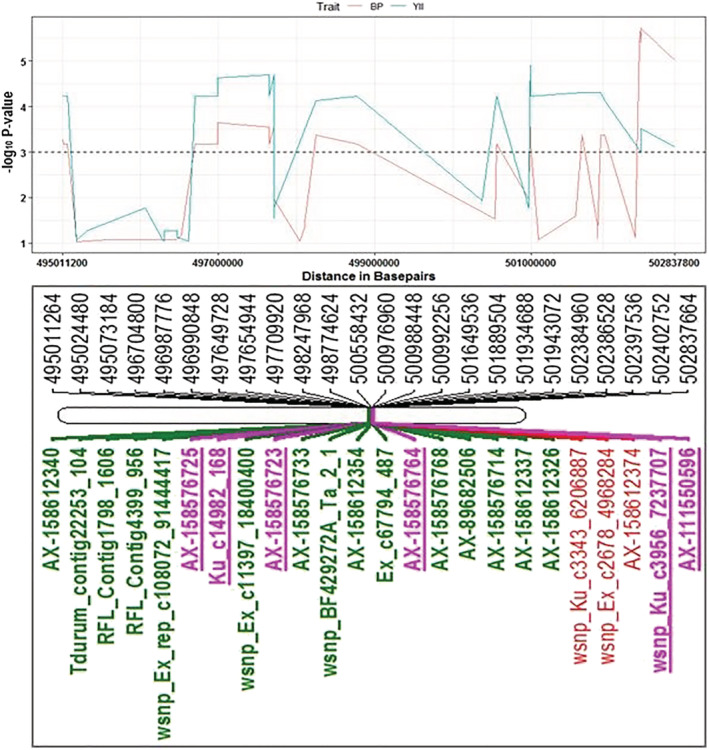
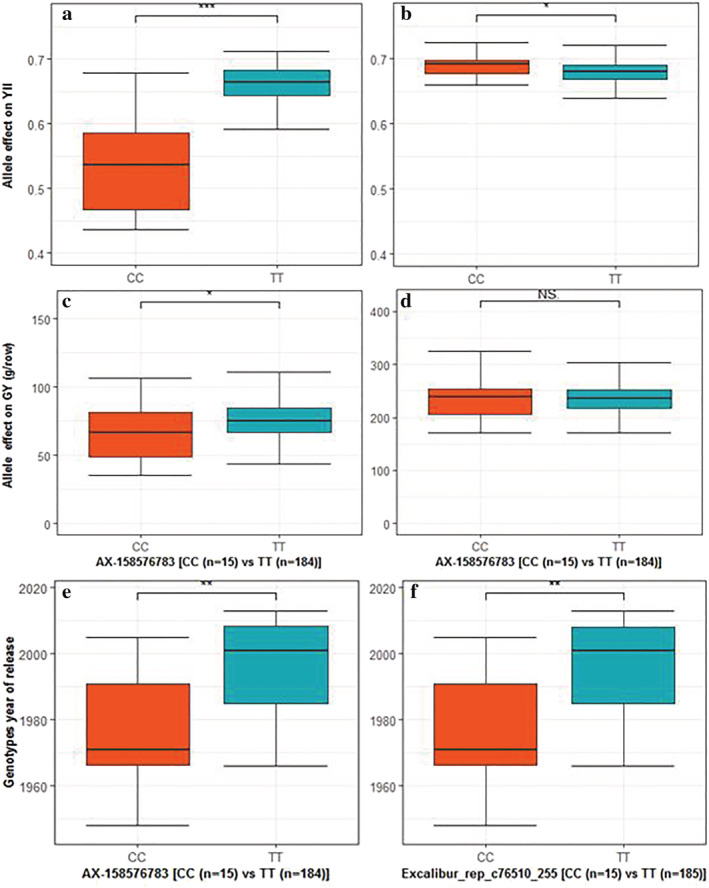
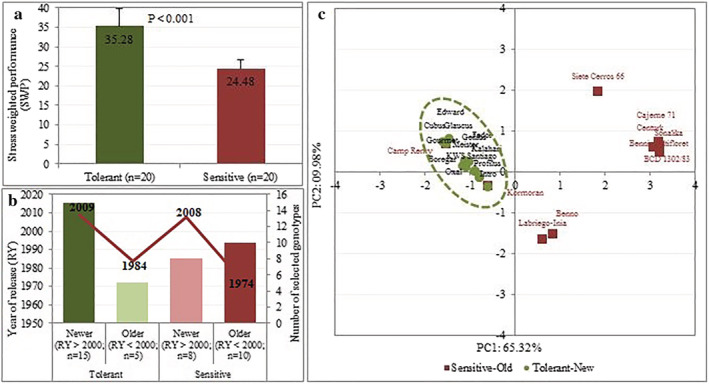
Water deficit is the most severe stress factor in crop production threatening global food security. In this study, we evaluated the genetic variation in photosynthetic traits among 200 wheat cultivars evaluated under drought and rainfed conditions. Significant genotypic, treatments, and their interaction effects were detected for chlorophyll content and chlorophyll fluorescence parameters. Drought stress reduced the effective quantum yield of photosystem II (YII) from the anthesis growth stage on. Leaf chlorophyll content measured at anthesis growth stages was significantly correlated with YII and non-photochemical quenching under drought conditions, suggesting that high throughput chlorophyll content screening can serve as a good indicator of plant drought tolerance status in wheat. Breeding significantly increased the photosynthetic efficiency as newer released genotypes had higher YII and chlorophyll content than the older ones. GWAS identified a stable drought-responsive QTL on chromosome 3A for YII, while under rainfed conditions, it detected another QTL on chromosome 7A for chlorophyll content across both growing seasons. Molecular analysis revealed that the associated alleles of AX-158576783 (515.889 Mbp) on 3A co-segregates with the NADH-ubiquinone oxidoreductase (TraesCS3A02G287600) gene involved in ATP synthesis coupled electron transport and is proximal to WKRY transcription factor locus. This allele on 3A has been positively selected through breeding and has contributed to increasing the grain yield.
Keywords: GWAS; breeding progress; chlorophyll content; chlorophyll fluorescence; drought; effective quantum yield of photosystem II; photosynthesis; wheat.
© 2022 The Authors. Plant Direct published by American Society of Plant Biologists and the Society for Experimental Biology and John Wiley & Sons Ltd.
Conflict of interest statement
The authors declare no conflict of interest associated with the work described in this manuscript.
Figures

Similar articles
-
Chlorophyll Fluorescence in Wheat Breeding for Heat and Drought Tolerance.Plants (Basel). 2024 Oct 3;13(19):2778. doi: 10.3390/plants13192778. Plants (Basel). 2024. PMID: 39409648 Free PMC article. Review.
-
Breeding Driven Enrichment of Genetic Variation for Key Yield Components and Grain Starch Content Under Drought Stress in Winter Wheat.Front Plant Sci. 2021 Aug 16;12:684205. doi: 10.3389/fpls.2021.684205. eCollection 2021. Front Plant Sci. 2021. PMID: 34484257 Free PMC article.
-
Genetic Potential and Inheritance Patterns of Physiological, Agronomic and Quality Traits in Bread Wheat under Normal and Water Deficit Conditions.Plants (Basel). 2022 Mar 31;11(7):952. doi: 10.3390/plants11070952. Plants (Basel). 2022. PMID: 35406932 Free PMC article.
-
Phenotypic variation in leaf photosynthetic traits, leaf area index, and carbon discrimination of field-grown wheat genotypes and their relationship with yield performance in Mediterranean environments.Planta. 2023 Jun 17;258(1):22. doi: 10.1007/s00425-023-04163-7. Planta. 2023. PMID: 37329469
-
Plant breeding and drought in C3 cereals: what should we breed for?Ann Bot. 2002 Jun;89 Spec No(7):925-40. doi: 10.1093/aob/mcf049. Ann Bot. 2002. PMID: 12102518 Free PMC article. Review.
Cited by
-
Genome-Wide Association Analyses Identify Hydrogen Peroxide-Responsive Loci in Wheat Diversity.Plant Direct. 2025 Apr 17;9(4):e70067. doi: 10.1002/pld3.70067. eCollection 2025 Apr. Plant Direct. 2025. PMID: 40248189 Free PMC article.
-
Genetic dissection of root architectural plasticity and identification of candidate loci in response to drought stress in bread wheat.BMC Genom Data. 2023 Jul 26;24(1):38. doi: 10.1186/s12863-023-01140-7. BMC Genom Data. 2023. PMID: 37495985 Free PMC article.
-
Drought-tolerant wheat for enhancing global food security.Funct Integr Genomics. 2024 Nov 13;24(6):212. doi: 10.1007/s10142-024-01488-8. Funct Integr Genomics. 2024. PMID: 39535570 Review.
-
Chlorophyll Fluorescence in Wheat Breeding for Heat and Drought Tolerance.Plants (Basel). 2024 Oct 3;13(19):2778. doi: 10.3390/plants13192778. Plants (Basel). 2024. PMID: 39409648 Free PMC article. Review.
-
Pinpointing genomic loci for drought-induced proline and hydrogen peroxide accumulation in bread wheat under field conditions.BMC Plant Biol. 2022 Dec 13;22(1):584. doi: 10.1186/s12870-022-03943-9. BMC Plant Biol. 2022. PMID: 36513990 Free PMC article.
References
-
- Araus, J. , Amaro, T. , Casadesus, J. , Asbati, A. , & Nachit, M. (1998). Relationships between ash content, carbon isotope discrimination and yield in durum wheat. Functional Plant Biology, 25, 835–842. 10.1071/PP98071 - DOI
-
- Araus, J. L. , Slafer, G. A. , Royo, C. , & Serret, M. D. (2008). Breeding for yield potential and stress adaptation in cereals. Critical Reviews in Plant Science, 27, 377–412. 10.1080/07352680802467736 - DOI
-
- Balla, K. , Bencze, S. , Bónis, P. , Árendás, T. , & Veisz, O. (2014). Changes in the photosynthetic efficiency of winter wheat in response to abiotic stress. Central European Journal of Biology, 9, 519–530.
LinkOut - more resources
Full Text Sources
Miscellaneous
