Review
. 2022 Jul 25;13(33):9485-9497.
doi: 10.1039/d2sc02872g. eCollection 2022 Aug 24.

Modeling titanium dioxide nanostructures for photocatalysis and photovoltaics

Affiliations
Review

Modeling titanium dioxide nanostructures for photocatalysis and photovoltaics

Francesca Nunzi et al. Chem Sci. .

Abstract

Heterogenous photocatalysis is regarded as a holy grail in relation to the energy and environmental issues with which our society is currently struggling. In this context, the characterization of titanium dioxide nanostructures and the relationships between structural/electronic parameters and chemical/physical-chemical properties is a primary target, whose achievement is in high demand. Theoretical simulations can strongly support experiments to reach this goal. While the bulk and surface properties of TiO2 materials are quite well understood, the field of nanostructures still presents a few unexplored areas. Here we consider possible approaches for the modeling of reduced and extended TiO2 nanostructures, and we review the main outcomes of the investigation of the structural, electronic, and optical properties of TiO2 nanoparticles and their relationships with the size, morphology, and shape of the particles. Further investigations are highly desired to fill the gaps still remaining and to allow improvements in the efficiencies of these materials for photocatalytic and photovoltaic applications.


Conflict of interest statement

There are no conflicts to declare.

Figures
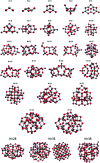
Fig. 1
Fig. 1. Atomic structures of the low-energy bottom-up (TiO2)n nanocrystals investigated in ref. . For N = 35, the structure on the right was obtained by data mining from a tetrahedral (CeO2)35 nanoparticle in ref. . Titanium, red; oxygen, grey. Reproduced from ref. with permission from the Royal Society of Chemistry.
Fig. 2
Fig. 2. Atomic structures of the top-down (TiO2)n nanocrystals investigated in ref. . The scale bar on the right strictly refers to the larger model. Titanium, red; oxygen, grey. Reproduced from ref. with permission from the Royal Society of Chemistry.
Fig. 3
Fig. 3. Energies of bottom-up and top-down (TiO2)n nanoclusters with the corresponding fitting lines. The NC ↔ C crossover size is indicated by the cross at n = 125 (i.e., 375 atoms). Reproduced from ref. with permission from the Royal Society of Chemistry.
Fig. 4
Fig. 4. The octahedral (top) and cuboctahedral (bottom) (TiO2)n nanoparticles investigated in ref. . Reprinted with permission from O. Lamiel-Garcia, K. C. Ko, J. Y. Lee, S. T. Bromley and F. Illas, J. Chem. Theory Comput., 2017, 13, 1785–1793. Copyright 2017 American Chemical Society.
Fig. 5
Fig. 5. Energy per TiO2 unit relative to anatase (ΔE/n) for the octahedral (Oh) and truncated octahedral (TOh) (TiO2)n nanoparticles investigated in ref. . For comparison, the authors included the values corresponding to the unrelaxed structure cut from the bulk and to the tight-binding relaxed structures from Barnard et al. Blue squares: single-point calculations using the bulk-cut structures (SP@BC); red dots: single-point calculations using the tight-binding relaxed structures (SP@TB); black diamonds: optimized Oh structures (Opt Oh); green triangles: optimized TOh structures (Opt TOh). Reprinted with permission from O. Lamiel-Garcia, K. C. Ko, J. Y. Lee, S. T. Bromley and F. Illas, J. Chem. Theory Comput., 2017, 13, 1785–1793. Copyright 2017 American Chemical Society.
Fig. 6
Fig. 6. (TiO2)n nanoparticles (n = 28–595) with (a) bipyramidal, (b) cuboctahedral, and (c) spherical morphologies, and (d) quasi-spherically globally optimised structures investigated in ref. . Red/blue spheres correspond to O/Ti atoms. Reproduced from ref. with permission from the Royal Society of Chemistry.
Fig. 7
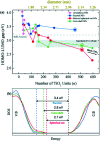
Fig. 7. The energy per TiO2 unit with respect to bulk anatase (set to zero) of faceted (blue), spherical cut (red), annealed core–shell spherical (green), and amorphous (magenta) (TiO2)n nanoparticles as a function of n. An estimation of the diameter is reported via the upper x-axis. The black arrows indicate the energetic stabilisation of the (TiO2)43, (TiO2)115, and (TiO2)136 core–shell nanoparticles upon annealing to nanoparticles with fully amorphized structures. Reproduced from ref. with permission from the Royal Society of Chemistry.
Fig. 8
Fig. 8. (a) Optical gap estimated as the HOMO–LUMO difference for faceted (blue), spherical cut (red), annealed core–shell spherical (green), and amorphous (magenta) (TiO2)n nanoparticles as a function of n. (b) The density of state (DOS) of faceted (TiO2)455 and relaxed direct cut and annealed spherical (TiO2)511 nanoparticles—corresponding to the circled data points in (a). Reproduced from ref. with permission from the Royal Society of Chemistry.
Fig. 9
Fig. 9. Top: faceted TiO2 NPs and a corresponding schematic representation of the Wulff-shape decahedron. Bottom: spherical TiO2 nanoparticles and a corresponding schematic representation of the sphere. The surface-to-bulk percentage ratio and stoichiometry are also shown. Reprinted with permission from G. Fazio, L. Ferrighi and C. Di Valentin, J. Phys. Chem. C, 2015, 119, 20735–20746. Copyright 2015 American Chemical Society.
Fig. 10
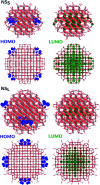
Fig. 10. Side (upper) and top (lower) views of the electronic density plots of the frontier orbitals of NCS and NCL (isosurface = 5 × 10⁻⁴ au). Reprinted with permission from G. Fazio, L. Ferrighi and C. Di Valentin, J. Phys. Chem. C, 2015, 119, 20735–20746. Copyright 2015 American Chemical Society.
Fig. 11
Fig. 11. Side (upper) and top (lower) views of the electronic density plots of the frontier orbitals of NSS and NSL (isosurface = 5 × 10⁻⁴ au, except for HOMO, for which isosurface = 1 × 10⁻³ au). Reprinted with permission from G. Fazio, L. Ferrighi and C. Di Valentin, J. Phys. Chem. C, 2015, 119, 20735–20746. Copyright 2015 American Chemical Society.

References

    1. Mills A. LeHunte S. J. Photochem. Photobiol. Chem. 1997;108:1–35. doi: 10.1016/S1010-6030(97)00118-4. - DOI
    1. Carp O. Huisman C. L. Reller A. Prog. Solid State Chem. 2004;32:33–177. doi: 10.1016/j.progsolidstchem.2004.08.001. - DOI
    1. Ni M. Leung M. K. H. Leung D. Y. C. Sumathy K. Renew. Sustain. Energy Rev. 2007;11:401–425. doi: 10.1016/j.rser.2005.01.009. - DOI
    1. Bai Y. Mora-Sero I. De Angelis F. Bisquert J. Wang P. Chem. Rev. 2014;114:10095–10130. doi: 10.1021/cr400606n. - DOI - PubMed
    1. O'Regan B. Grätzel M. Nature. 1991;353:737–740. doi: 10.1038/353737a0. - DOI