. 2022 Aug 1;13(33):9739-9748.
doi: 10.1039/d2sc02355e. eCollection 2022 Aug 24.

Intra Q-body: an antibody-based fluorogenic probe for intracellular proteins that allows live cell imaging and sorting

Affiliations

Intra Q-body: an antibody-based fluorogenic probe for intracellular proteins that allows live cell imaging and sorting

Yancen Dai et al. Chem Sci. .

Abstract

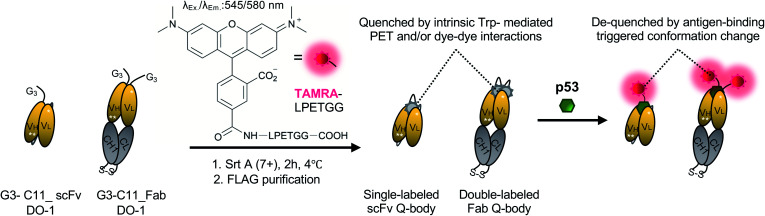
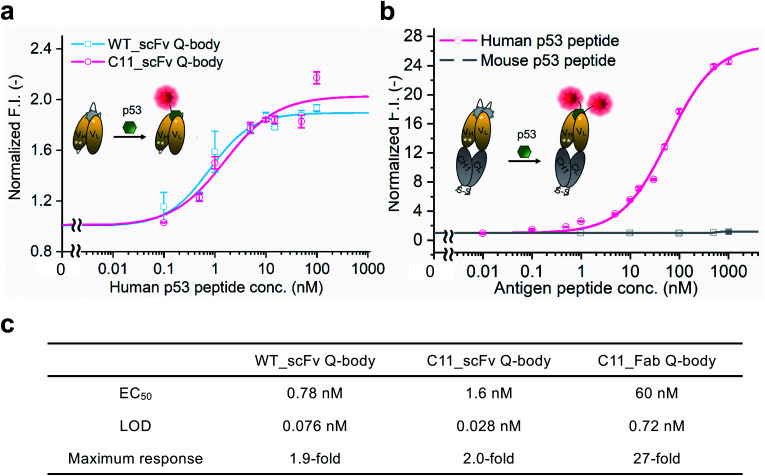
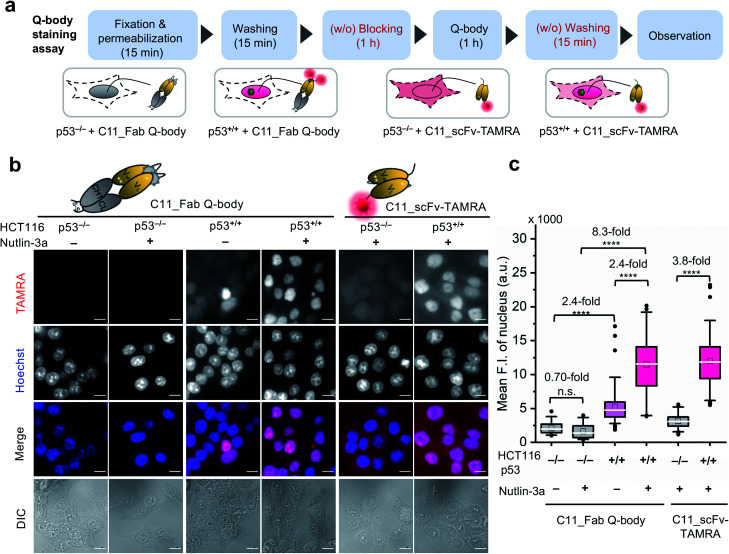
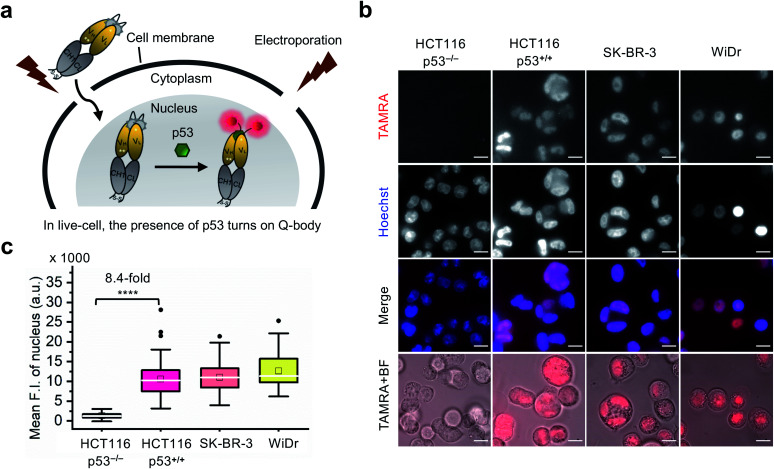
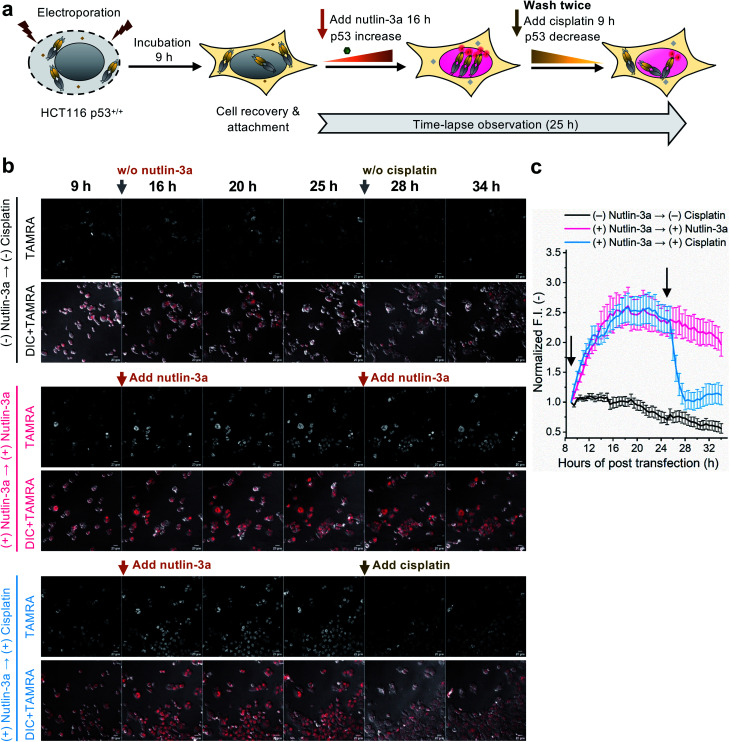
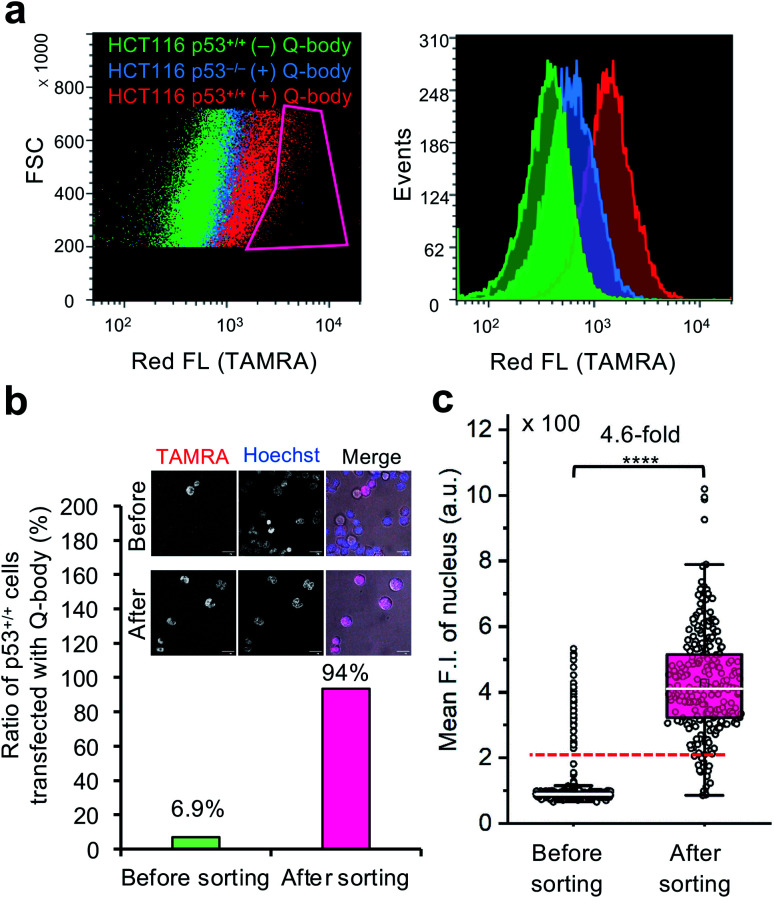
Although intracellular biomarkers can be imaged with fluorescent dye(s)-labeled antibodies, the use of such probes for precise imaging of intracellular biomarkers in living cells remains challenging due to background noise from unbound probes. Herein, we describe the development of a conditionally active Fab-type Quenchbody (Q-body) probe derived from a monoclonal antibody (DO-1) with the ability to both target and spatiotemporally visualize intracellular p53 in living cells with low background signal. p53 is a key tumor suppressor and validated biomarker for cancer diagnostics and therapeutics. The Q-body displayed up to 27-fold p53 level-dependent fluorescence enhancement in vitro with a limit of detection of 0.72 nM. In fixed and live cells, 8.3- and 8.4-fold enhancement was respectively observed. Furthermore, we demonstrate live-cell sorting based on p53 expression. This study provides the first evidence of the feasibility and applicability of Q-body probes for the live-cell imaging of intrinsically intracellular proteins and opens a novel avenue for research and diagnostic applications on intracellular target-based live-cell sorting.


Conflict of interest statement

There are no conflicts to declare.

Figures

Scheme 1
Scheme 1. Schematics of preparing single-labeled or double-labeled Q-bodies by transpeptidase Srt A (7+) and working image of Q-bodies with target antigen p53 peptide. Abbreviation: Srt A (7+), a mutant of sortase A; Trp: tryptophan residues; PET: photoinduced electron transfer; Ex, excitation; Em, emission. White stars represent mutation sites in the C11 mutant.
Fig. 1
Fig. 1. Performance of Q-bodies in PBST buffer. (a) Dose–response fitting curves of single-labeled WT (blue line) and C11 (red line) _scFv Q-bodies at 1 nM concentration for human p53 peptide. (b) Dose–response fitting curves of double-labeled C11_Fab Q-body at 1 nM concentration for human p53 (red line) and mouse p53 (gray line) peptides. (c) EC50, LOD, and the maximum response of Q-bodies. Normalized F.I.: the fluorescence intensities (F.I.) of Q-body at each antigen concentration were divided by that of antigen in the absence of antigen. Human p53 peptide: EPPLSQETFSDLWKLLPENN (bold characters indicate the epitope of DO-1); Mouse p53 peptide: SGSGTFSGLWKLLPPEDIL. The DO-1 does not recognize mouse p53 peptides because of one amino acid difference (G in the italic letter) in its epitope. Four parameters logistic equation was used for the fitting of dose–response curves. Data are shown as the mean ± SD (n = 3).
Fig. 2
Fig. 2. Wash-free visualization of p53 in fixed human cancer cells using C11_Fab Q-body. HCT116 p53−/− or p53+/+ are human colon cancer cell lines. A representative of a traditional direct immunofluorescence probe (C11_scFv-TAMRA) was applied as a control to compare the performance of the C11_Fab Q-body. Nutlin-3a, an MDM2 inhibitor, was used to stabilize the p53 protein and improve p53 levels. (a) Schematic of wash-free fixed cell staining assay by C11_Fab Q-body and C11_ scFv-TAMRA in a time-saving manner. (b) Representative images showing 40 nM C11_Fab Q-body or C11_scFv-TAMRA staining of p53 in HCT116 p53−/− or p53+/+ cells after being treated with 12 μM nutlin-3a or 0.06% ethanol for 16 h. TAMRA (red), C11_Fab Q-body or C11_scFv-TAMRA; Hoechst (blue), 1 μg mL−1 Hoechst 33 342; Merge, overlapped TAMRA with Hoechst; DIC, differential interference contrast. Scale bar, 10 μm. (c) Box plot of mean TAMRA intensities in the nucleus subtracted to minimum fluorescence intensities (F.I.) of TAMRA channel. The median F.I. was used to calculate their fluorescence changes between groups. The first four boxes: one-way ANOVA test; the last two boxes: Welch's t-test. ****p < 0.0001; n.s., not significant; from left to right, n = 39, 36, 78, 53, 83, 79 cells. For the box plot, the white line indicates the median, the box indicates 25–75% range, whiskers indicate 1.5 interquartile range, and the black dot indicates outliers.
Fig. 3
Fig. 3. Wash-free imaging of intracellular p53 in live-cell using C11_Fab Q-body. Four cell lines, including HCT116 p53+/+ (WT p53), HCT116 p53−/− (p53 null), SK-BR-3 [mutant p53 (pR175H)], and WiDr [mutant p53 (pR273H)] were employed. (a) Scheme of Q-body in live-cell imaging assay. Following treatment with 12 μM nutlin-3a for 16 h, cells were electroporated to drive Q-bodies (200 nM) into cells through transiently formed pores at the cell membrane. In p53-expressing cells, the Q-body turns on. (b) Representative images of live-cell imaging assay. HCT116 p53−/− cells were used as a negative control showing background signals of C11_Fab Q-body in live-cell. The other three cell lines were employed to understand the performance of antigen-dependent fluorescence enhancement of Q-body inside live-cell. Scale bar, 10 μm. (c) Box plot of mean TAMRA intensities in the nucleus subtracted to minimum fluorescence intensities (F.I.) of TAMRA channel. The median F.I. was used to calculate fluorescence changes between groups. Welch's t-test. ****p < 0.0001; from left to right, n = 106, 122, 77, 66 cells. For the box plot, the white line indicates the median, the box indicates 25–75% range, whiskers indicate 1.5 interquartile range, and the black dot indicates outliers.
Fig. 4
Fig. 4. Time-lapse observation of p53 dynamics in HCT116 p53+/+ using C11_Fab Q-body. (a) Schematics of time-lapse imaging assay. The cells were incubated for 9 h to allow cell recovery and adherence following electroporation. After the addition of 12 μM nutlin-3a, time-lapsed observation commenced. After 16 h, the old medium containing nutlin-3a was removed and gently washed twice with fresh medium, then treated with fresh medium containing 12 μM nutlin-3a or 6 μM cisplatin. Cisplatin is an anti-cancer chemotherapy drug. (b) Representative images of HCT116 p53+/+ cells transfected with C11_Fab Q-body after being treated with nutlin-3a, cisplatin, or non-treated as indicated. Red color, TAMRA channel. DIC, differential interference contrast. Scale bar, 20 μm. (c) Time-dependent TAMRA intensity changes in nuclei. Normalized F.I. of the nucleus, the mean fluorescence intensity (F.I.) of nucleus areas subtracted to that in the blank area, then normalized to the F.I. of the start point (9 h). Data are presented as the mean ± SEM of 18 cells. All images were acquired as Z-stacks (five sections at 2.5 μm intervals), and the most representative Z-stack images were presented and used for F.I. analysis.
Fig. 5
Fig. 5. Intracellular antigen-specific live-cell sorting using C11_Fab Q-body. (a) Flow cytometry analysis of HCT116 p53+/+ cells transfected with (red) or without (green) Q-body and HCT116 p53−/− cells with (blue) Q-body. Left figure: density plot (Red box indicates the sorting gate); right figure: histogram plot. (b) The ratio of HCT116 p53+/+ cells transfected with C11_Fab Q-body before and after sorting. Their ratio was determined based on the mean F.I. of cell nuclei from their fluorescence images. The cells with mean F.I. below the red dotted line (F.I. < 200) in (c) were counted as negative cells. Representative photos before and after sorting are presented. Merge, TAMRA (red) + Hoechst (blue) + Bright field (gray). Scale bar, 20 μm. (c) Box plot of mean TAMRA intensities in nuclei subtracted to that in the blank areas (before sorting, n = 535; after sorting, n = 246). The median F.I. was used to calculate their fluorescence changes between groups. Welch's t-test. ****p < 0.0001. For the box plot, the white line indicates the median, the box indicates 25–75% range, whiskers indicate 1.5 interquartile range, and circles indicate data distributions.

Similar articles

Cited by

References

    1. Keppler A. Gendreizig S. Gronemeyer T. Pick H. Vogel H. Johnsson K. Nat. Biotechnol. 2003;21:86–89. doi: 10.1038/nbt765. - DOI - PubMed
    1. Los G. V. Encell L. P. McDougall M. G. Hartzell D. D. Karassina N. Zimprich C. Wood M. G. Learish R. Ohana R. F. Urh M. Simpson D. Mendez J. Zimmerman K. Otto P. Vidugiris G. Zhu J. Darzins A. Klaubert D. H. Bulleit R. F. Wood K. V. ACS Chem. Biol. 2008;3:373–382. doi: 10.1021/cb800025k. - DOI - PubMed
    1. Anson F. Kanjilal P. Thayumanavan S. Hardy J. A. Protein Sci. 2021;30:366–380. doi: 10.1002/pro.3992. - DOI - PMC - PubMed
    1. Sheng W. Nick S. T. Santos E. M. Ding X. Zhang J. Vasileiou C. Geiger J. H. Borhan B. Angew. Chem., Int. Ed. Engl. 2018;57:16083–16087. doi: 10.1002/anie.201810065. - DOI - PMC - PubMed
    1. Werther P. Yserentant K. Braun F. Grussmayer K. Navikas V. Yu M. Zhang Z. Ziegler M. J. Mayer C. Gralak A. J. Busch M. Chi W. Rominger F. Radenovic A. Liu X. Lemke E. A. Buckup T. Herten D. P. Wombacher R. ACS Cent. Sci. 2021;7:1561–1571. doi: 10.1021/acscentsci.1c00703. - DOI - PMC - PubMed