

Switching from ultrafast electron transfer to proton transfer in excited drug-protein complexes upon biotransformation
- PMID: 36091919
- PMCID: PMC9400592
- DOI: 10.1039/d2sc03257k
Switching from ultrafast electron transfer to proton transfer in excited drug-protein complexes upon biotransformation
Abstract
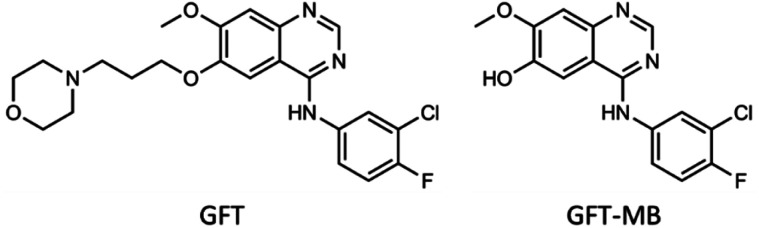
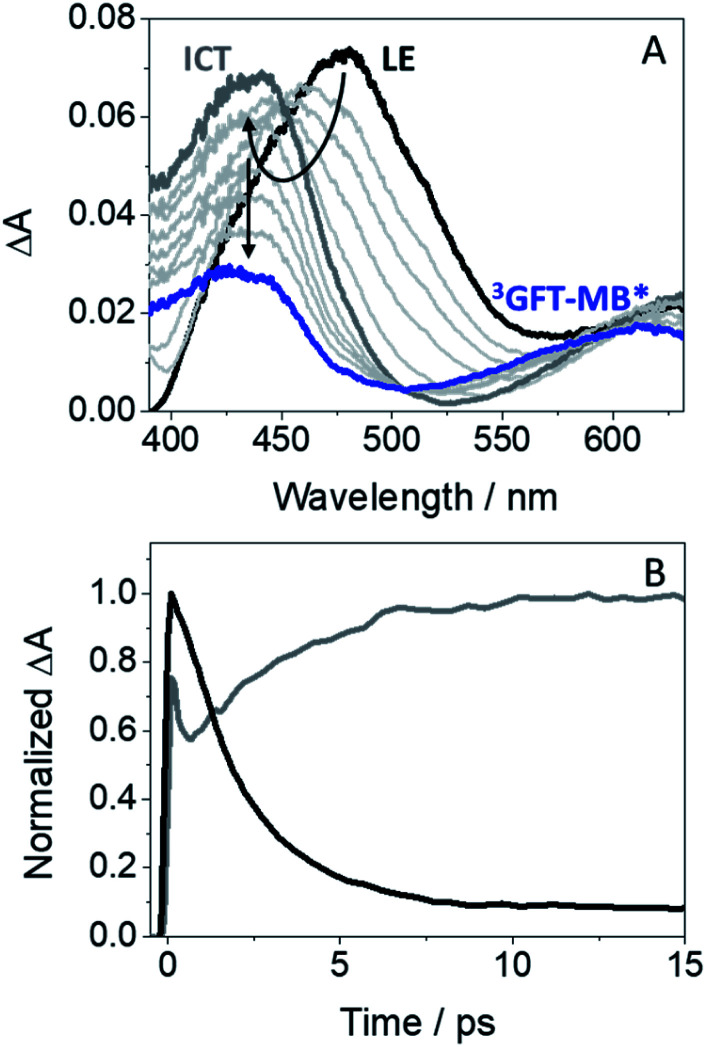
Photosensitization by drugs is directly related with the excited species and the photoinduced processes arising from interaction with UVA light. In this context, the ability of gefitinib (GFT), a tyrosine kinase inhibitor (TKI) used for the treatment of a variety of cancers, to induce phototoxicity and photooxidation of proteins has recently been demonstrated. In principle, photodamage can be generated not only by a given drug but also by its photoactive metabolites that maintain the relevant chromophore. In the present work, a complete study of O-desmorpholinopropyl gefitinib (GFT-MB) has been performed by means of fluorescence and ultrafast transient absorption spectroscopies, in addition to molecular dynamics (MD) simulations. The photobehavior of the GFT-MB metabolite in solution is similar to that of GFT. However, when the drug or its metabolite are in a constrained environment, i.e. within a protein, their behavior and the photoinduced processes that arise from their interaction with UVA light are completely different. For GFT in complex with human serum albumin (HSA), locally excited (LE) singlet states are mainly formed; these species undergo photoinduced electron transfer with Tyr and Trp. By contrast, since GFT-MB is a phenol, excited state proton transfer (ESPT) to form phenolate-like excited species might become an alternative deactivation pathway. As a matter of fact, the protein-bound metabolite exhibits higher fluorescence yields and longer emission wavelengths and lifetimes than GFT@HSA. Ultrafast transient absorption measurements support direct ESPT deprotonation of LE states (rather than ICT), to form phenolate-like species. This is explained by MD simulations, which reveal a close interaction between the phenolic OH group of GFT-MB and Val116 within site 3 (subdomain IB) of HSA. The reported findings are relevant to understand the photosensitizing properties of TKIs and the role of biotransformation in this type of adverse side effects.
This journal is © The Royal Society of Chemistry.
Conflict of interest statement
There are no conflicts to declare.
Figures


Similar articles
-
Modulation of the photobehavior of gefitinib and its phenolic metabolites by human transport proteins.Front Pharmacol. 2024 May 16;15:1387057. doi: 10.3389/fphar.2024.1387057. eCollection 2024. Front Pharmacol. 2024. PMID: 38818381 Free PMC article.
-
Photoprocesses of the tyrosine kinase inhibitor gefitinib: from femtoseconds to microseconds and from solution to cells.Chem Sci. 2021 Jul 13;12(36):12027-12035. doi: 10.1039/d1sc03154f. eCollection 2021 Sep 22. Chem Sci. 2021. PMID: 34667568 Free PMC article.
-
Cellular photo(geno)toxicity of gefitinib after biotransformation.Front Pharmacol. 2023 Jun 7;14:1208075. doi: 10.3389/fphar.2023.1208075. eCollection 2023. Front Pharmacol. 2023. PMID: 37351506 Free PMC article.
-
Excited states in DNA strands investigated by ultrafast laser spectroscopy.Top Curr Chem. 2015;356:39-87. doi: 10.1007/128_2014_570. Top Curr Chem. 2015. PMID: 25326834 Review.
-
Revealing the role of excited state proton transfer (ESPT) in excited state hydrogen transfer (ESHT): systematic study in phenol-(NH3) n clusters.Chem Sci. 2021 Feb 10;12(11):3836-3856. doi: 10.1039/d0sc06877b. Chem Sci. 2021. PMID: 34163653 Free PMC article. Review.
Cited by
-
Modulation of the photobehavior of gefitinib and its phenolic metabolites by human transport proteins.Front Pharmacol. 2024 May 16;15:1387057. doi: 10.3389/fphar.2024.1387057. eCollection 2024. Front Pharmacol. 2024. PMID: 38818381 Free PMC article.
References
-
- Gonçalo M., in Contact Dermatitis, ed. J. D. Johansen, Springer-Verlag, Berlin, 2011, ch. 18, pp. 361–376
LinkOut - more resources
Full Text Sources
Research Materials
Miscellaneous