

Intrapartum cardiotocography trace pattern pre-processing, features extraction and fetal health condition diagnoses based on RCOG guideline
- PMID: 36092005
- PMCID: PMC9454876
- DOI: 10.7717/peerj-cs.1050
Intrapartum cardiotocography trace pattern pre-processing, features extraction and fetal health condition diagnoses based on RCOG guideline
Abstract
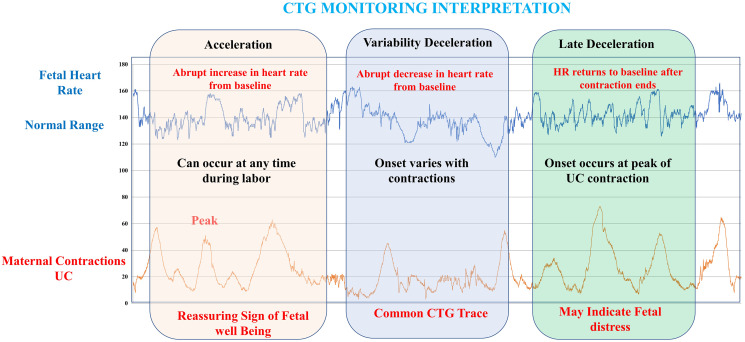
Context: The computerization of both fetal heart rate (FHR) and intelligent classification modeling of the cardiotocograph (CTG) is one of the approaches that are utilized in assisting obstetricians in conducting initial interpretation based on (CTG) analysis. CTG tracing interpretation is crucial for the monitoring of the fetal status during weeks into the pregnancy and childbirth. Most contemporary studies rely on computer-assisted fetal heart rate (FHR) feature extraction and CTG categorization to determine the best precise diagnosis for tracking fetal health during pregnancy. Furthermore, through the utilization of a computer-assisted fetal monitoring system, the FHR patterns can be precisely detected and categorized.
Objective: The goal of this project is to create a reliable feature extraction algorithm for the FHR as well as a systematic and viable classifier for the CTG through the utilization of the MATLAB platform, all the while adhering to the recognized Royal College of Obstetricians and Gynecologists (RCOG) recommendations.
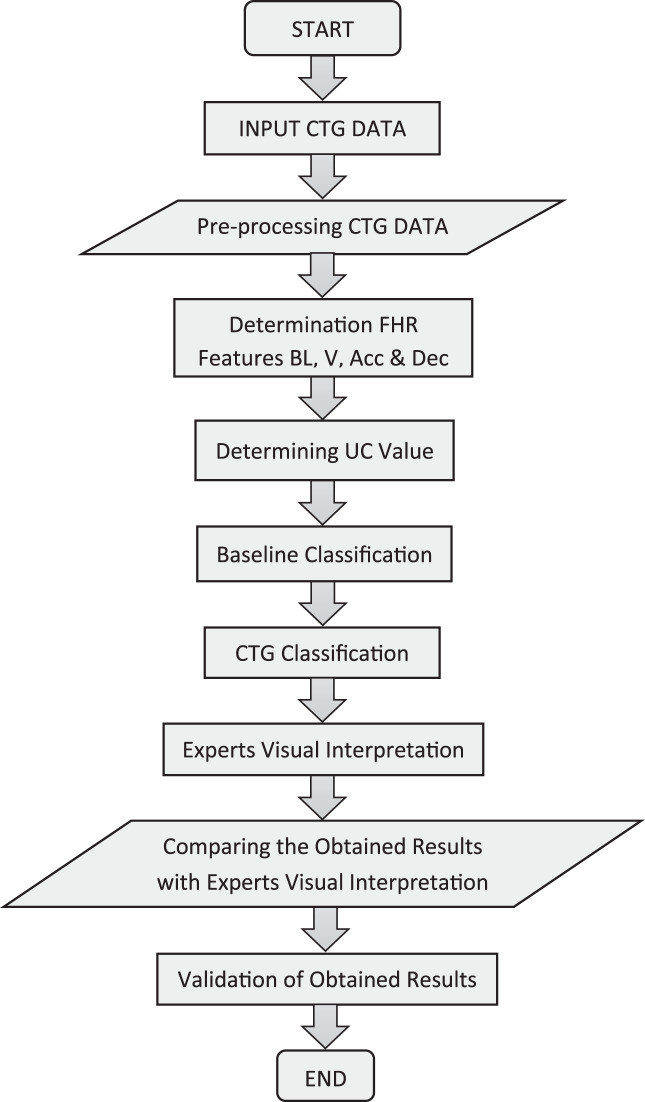
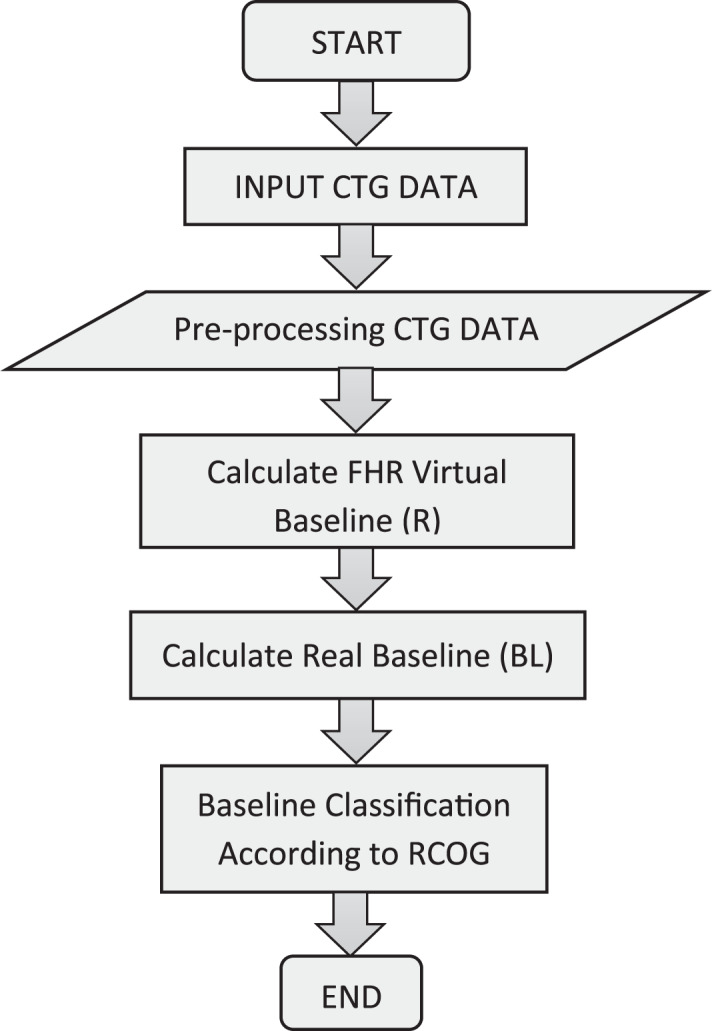
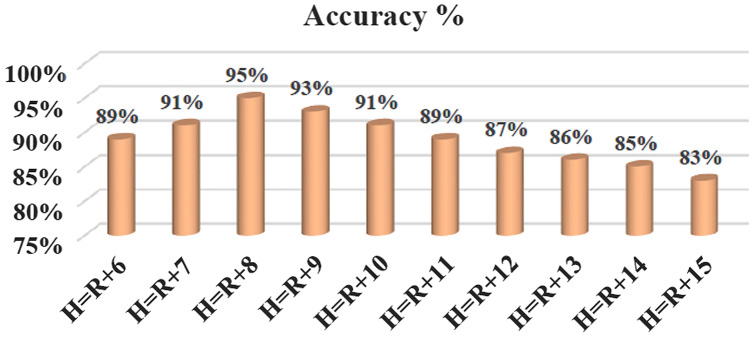
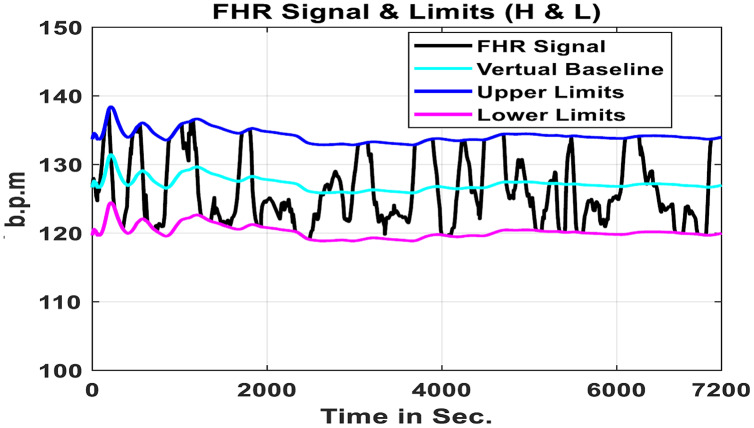
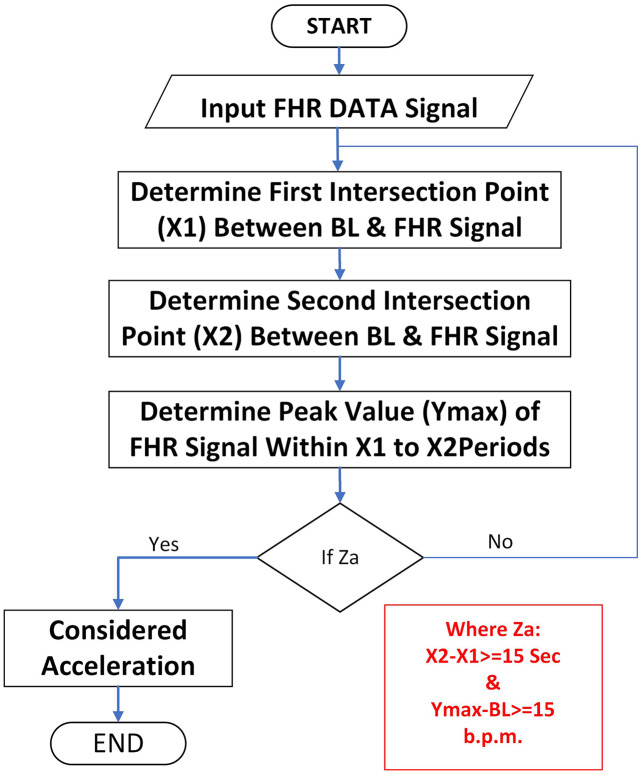
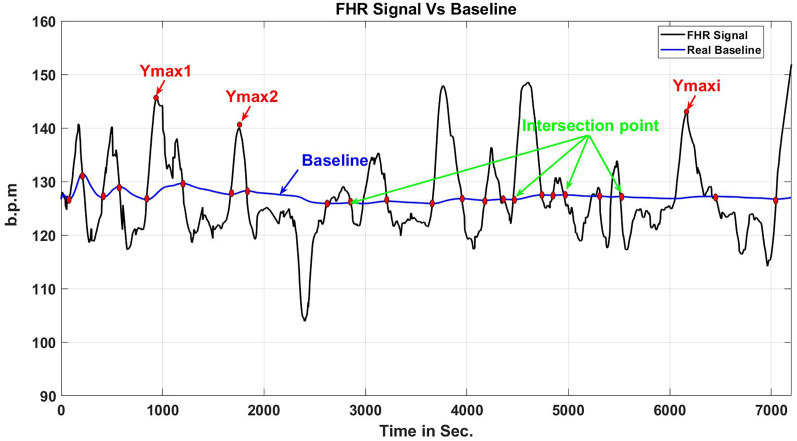
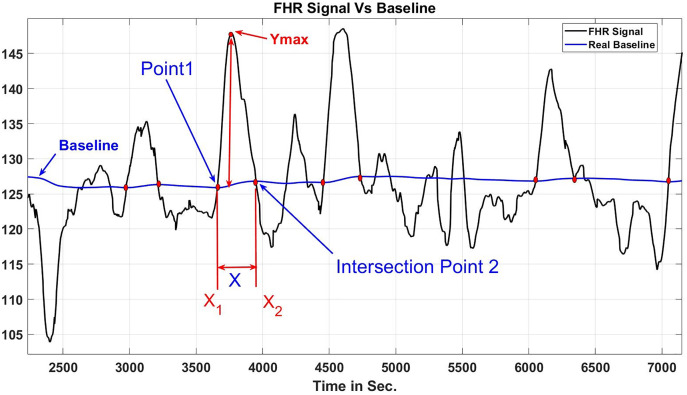
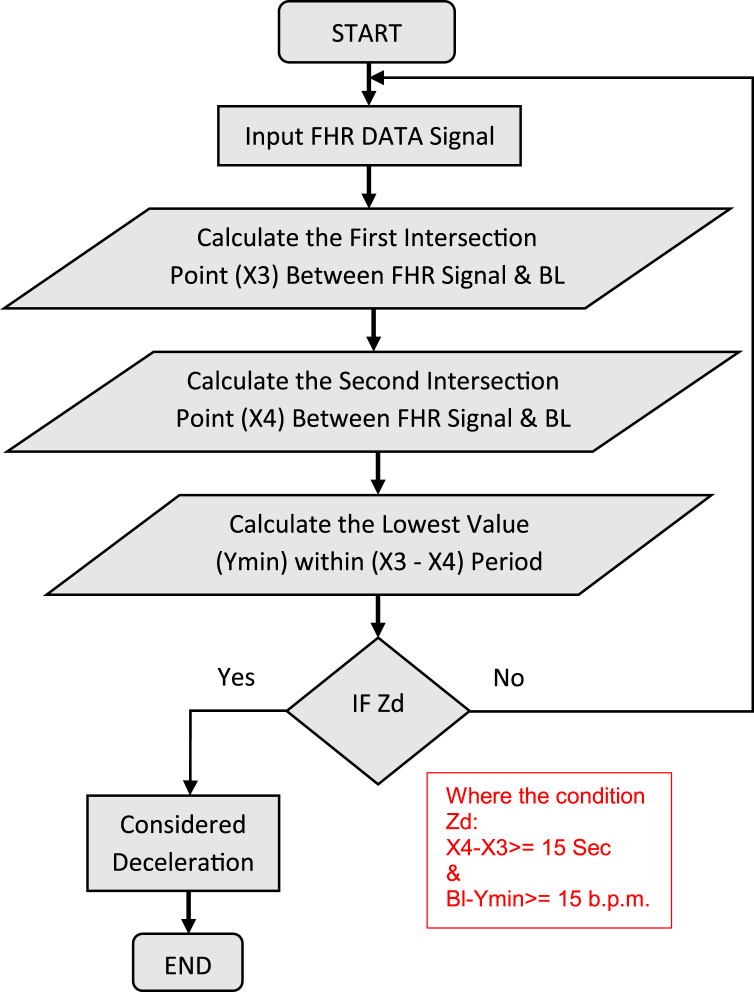
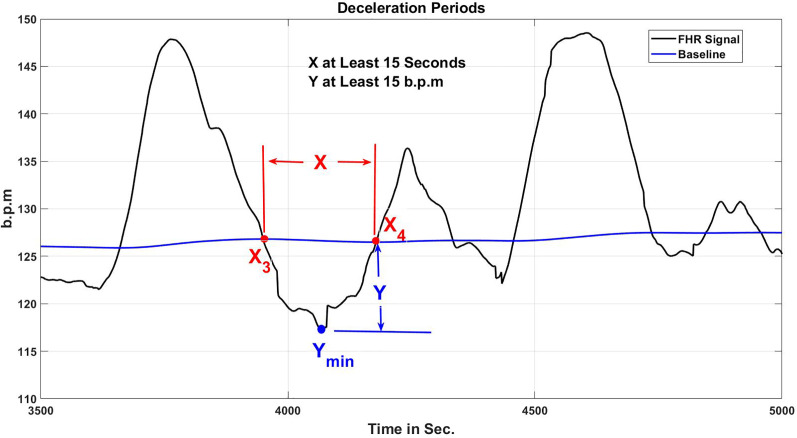
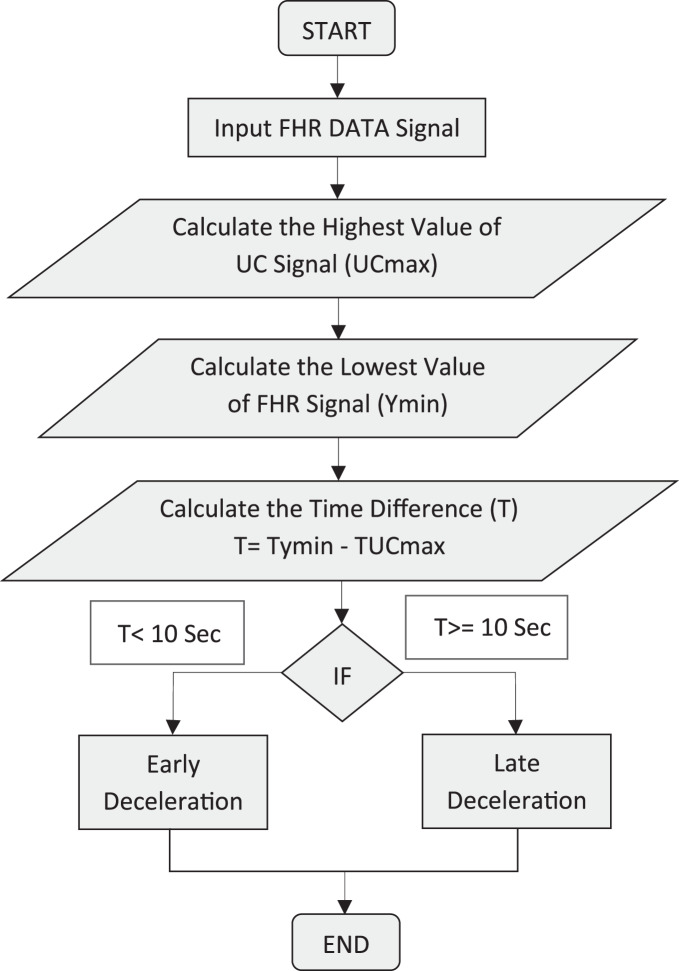
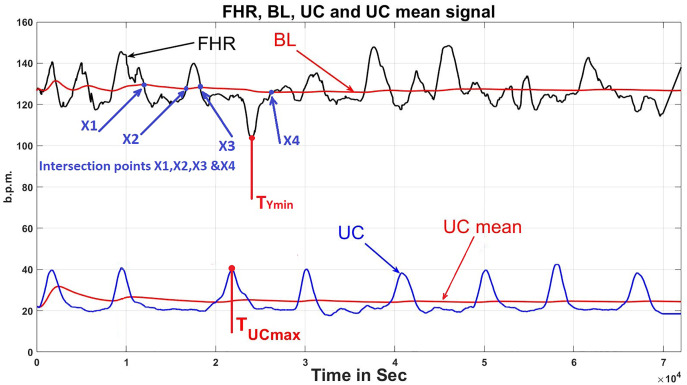
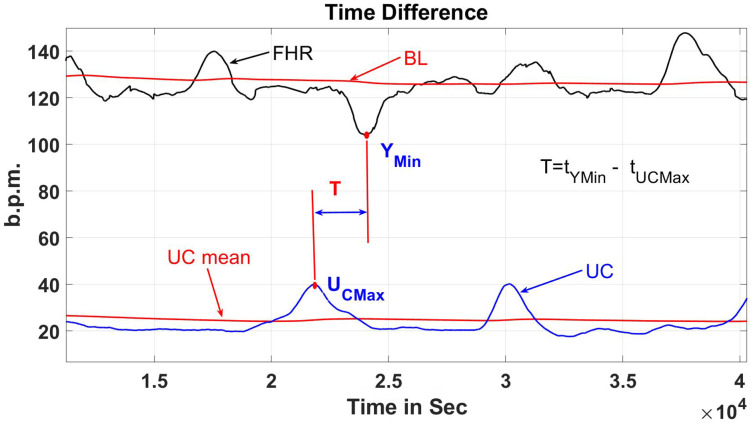
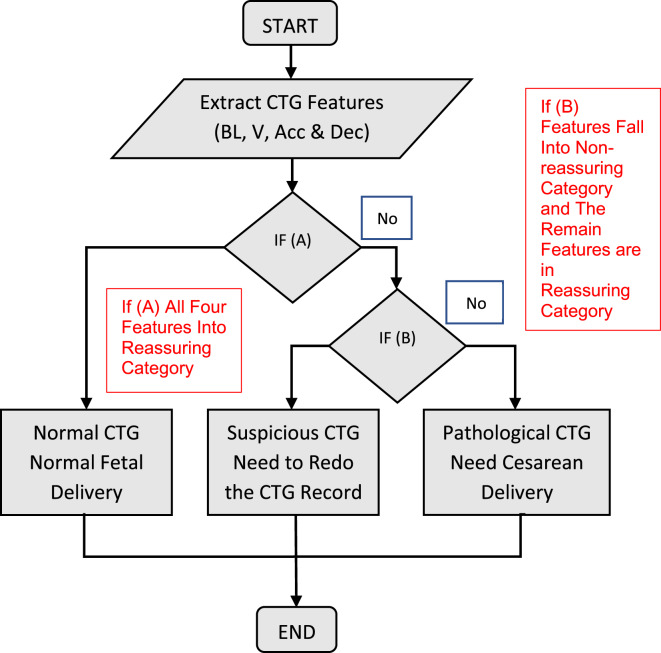
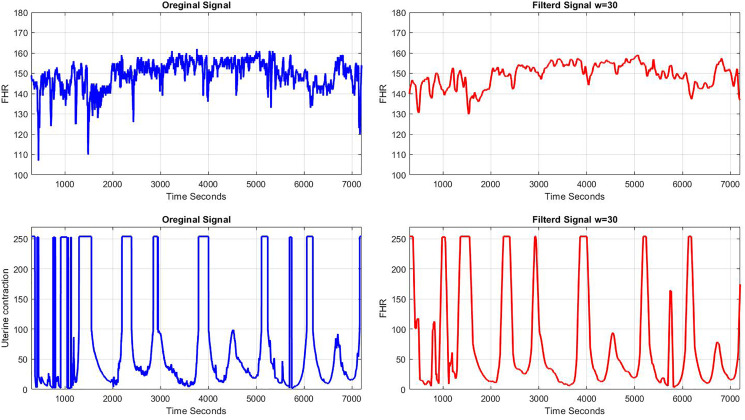
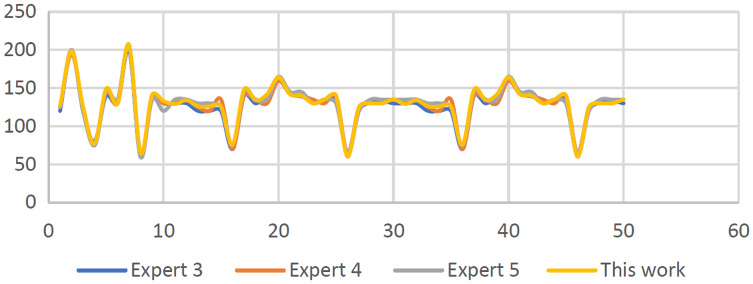
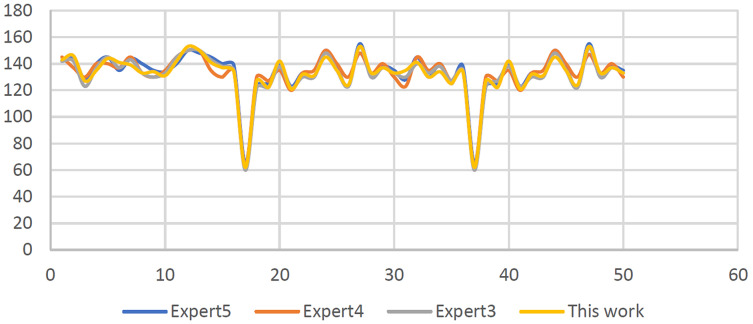
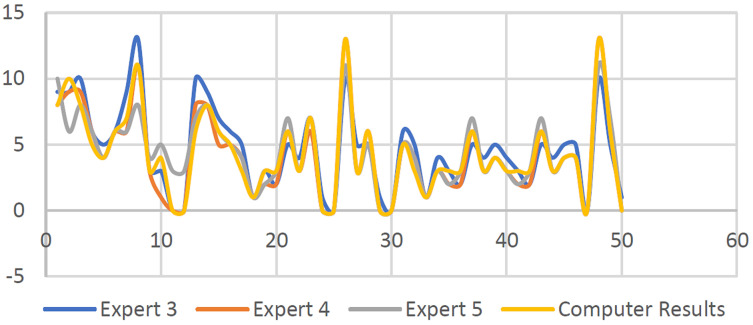
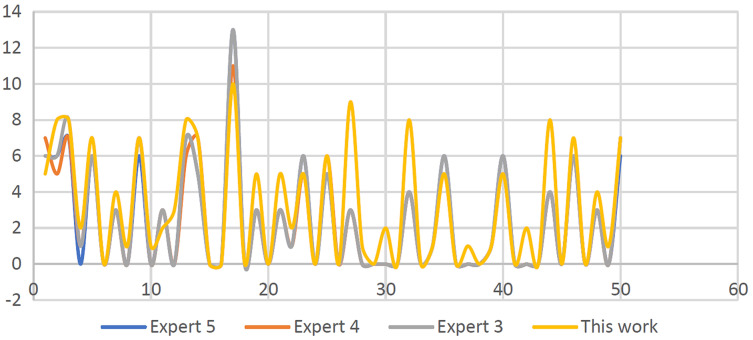
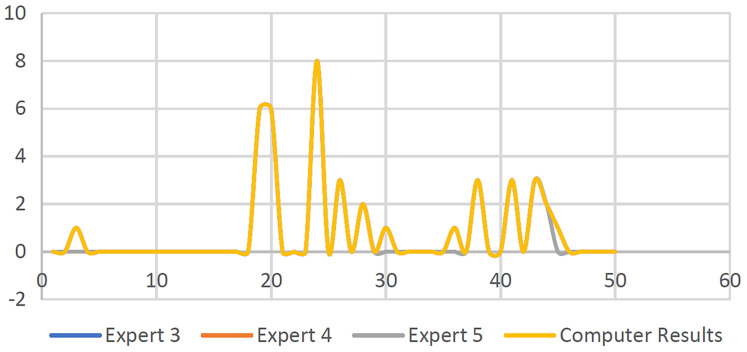
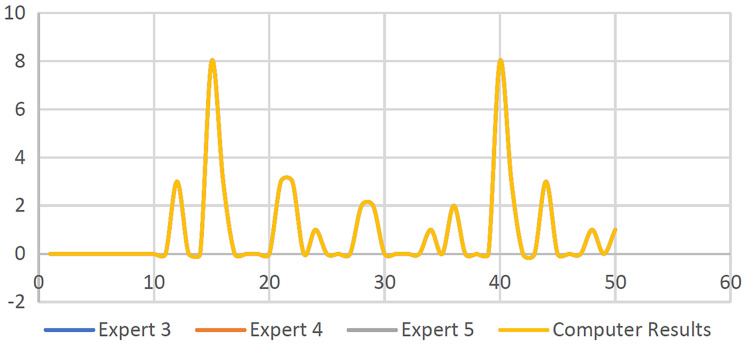
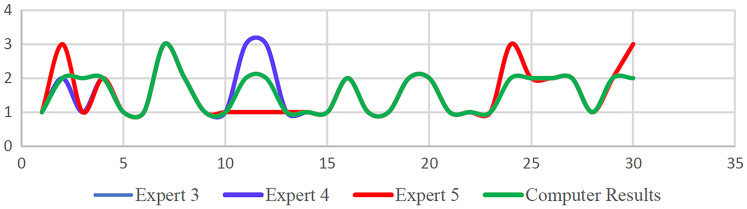
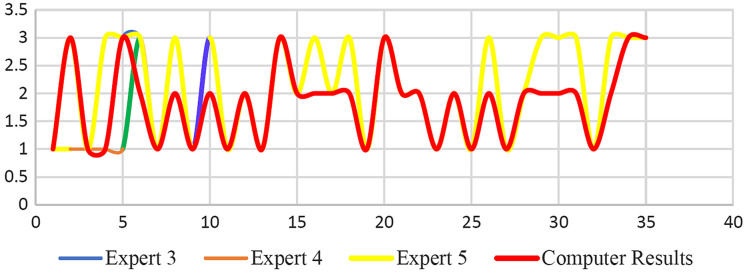
Method: The compiled CTG data from spiky artifacts were cleaned by a specifically created application and compensated for missing data using the guidelines provided by RCOG and the MATLAB toolbox after the implemented data has been processed and the FHR fundamental features have been extracted, for example, the baseline, acceleration, deceleration, and baseline variability. This is followed by the classification phase based on the MATLAB environment. Next, using the guideline provided by the RCOG, the signals patterns of CTG were classified into three categories specifically as normal, abnormal (suspicious), or pathological. Furthermore, to ensure the effectiveness of the created computerized procedure and confirm the robustness of the method, the visual interpretation performed by five obstetricians is compared with the results utilizing the computerized version for the 150 CTG signals.
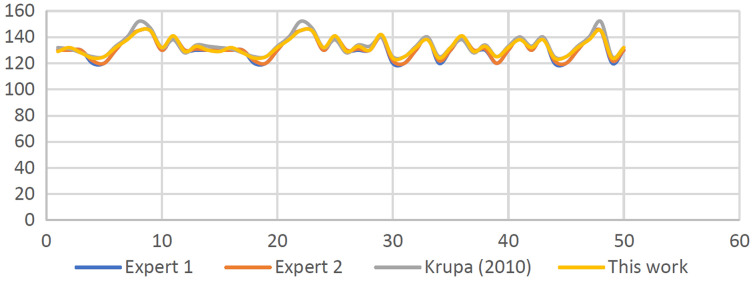
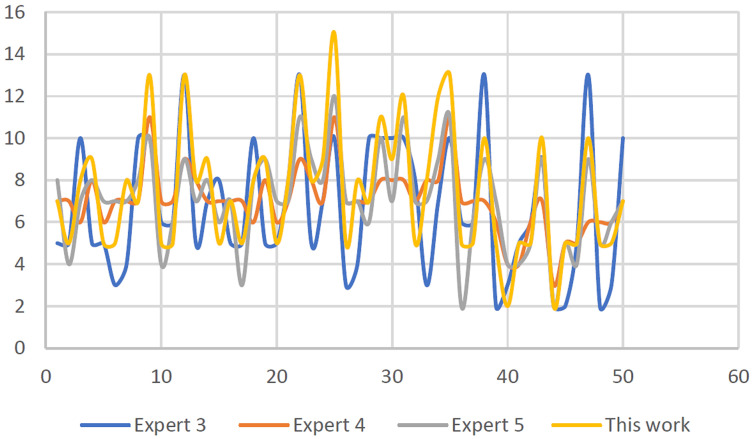
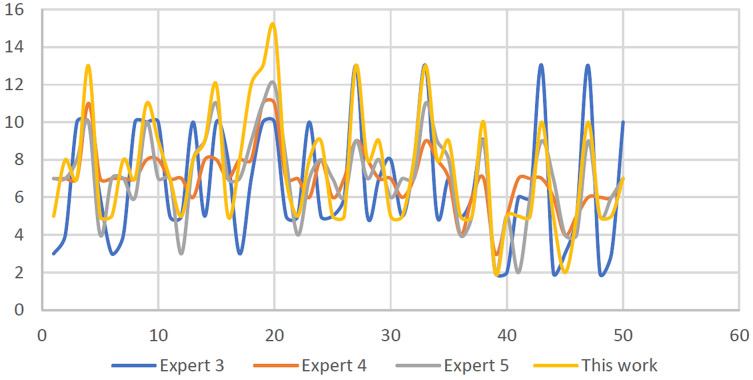
Results: The attained CTG signal categorization results revealed that there is variability, particularly a trivial dissimilarity of approximately (+/-4 and 6) beats per minute (b.p.m.). It was demonstrated that obstetricians' observations coincide with algorithms based on deceleration type and number, except for acceleration values that differ by up to (+/-4).
Discussion: The results obtained based on CTG interpretation showed that the utilization of the computerized approach employed in infirmaries and home care services for pregnant women is indeed suitable.
Conclusions: The classification based on CTG that was used for the interpretation of the FHR attribute as discussed in this study is based on the RCOG guidelines. The system is evaluated and validated by experts based on their expert opinions and was compared with the CTG feature extraction and classification algorithms developed using MATLAB.
Keywords: Cardiotocograph; Electronic fetal monitoring; Fetal heart rate; Uterine contraction.
© 2022 Al-yousif et al.
Conflict of interest statement
The authors declare that they have no competing interests.
Figures


Similar articles
-
eCTG: an automatic procedure to extract digital cardiotocographic signals from digital images.Comput Methods Programs Biomed. 2018 Mar;156:133-139. doi: 10.1016/j.cmpb.2017.12.030. Epub 2018 Jan 2. Comput Methods Programs Biomed. 2018. PMID: 29428065
-
A systematic review of automated pre-processing, feature extraction and classification of cardiotocography.PeerJ Comput Sci. 2021 Apr 27;7:e452. doi: 10.7717/peerj-cs.452. eCollection 2021. PeerJ Comput Sci. 2021. PMID: 33987454 Free PMC article.
-
Developments in CTG analysis.Baillieres Clin Obstet Gynaecol. 1996 Jun;10(2):185-209. doi: 10.1016/s0950-3552(96)80033-2. Baillieres Clin Obstet Gynaecol. 1996. PMID: 8836480 Review.
-
Intelligent antepartum fetal monitoring via deep learning and fusion of cardiotocographic signals and clinical data.Health Inf Sci Syst. 2023 Mar 19;11(1):16. doi: 10.1007/s13755-023-00219-w. eCollection 2023 Dec. Health Inf Sci Syst. 2023. PMID: 36950107 Free PMC article.
-
Critical Imperative for the Reform of British Interpretation of Fetal Heart Rate Decelerations: Analysis of FIGO and NICE Guidelines, Post-Truth Foundations, Cognitive Fallacies, Myths and Occam's Razor.J Clin Med Res. 2017 Apr;9(4):253-265. doi: 10.14740/jocmr2877e. Epub 2017 Feb 21. J Clin Med Res. 2017. PMID: 28270884 Free PMC article. Review.
References
-
- Akhavan-Amjadi M. Fetal electrocardiogram modeling using hybrid evolutionary firefly algorithm and extreme learning machine. Multidimensional Systems and Signal Processing. 2020;31(1):117–133. doi: 10.1007/s11045-019-00653-8. - DOI
-
- Al-Yousif S, Jaenu A, Al-Dayyeni W, Alamoodi A, Najm IA, Md Tahir N, Alrawi AAA, Cömert Z, Al-shareefi NA, Saleh AH. A systematic review of automated pre-processing, feature extraction and classification of cardiotocography. PeerJ Computer Science. 2021;7:e452. doi: 10.7717/peerj-cs.452. - DOI - PMC - PubMed
-
- Alsaggaf W, Cömert Z, Nour M, Polat K, Brdesee H, Toğaçar M. Predicting fetal hypoxia using common spatial pattern and machine learning from cardiotocography signals. Applied Acoustics. 2020;167:107429. doi: 10.1016/j.apacoust.2020.107429. - DOI
LinkOut - more resources
Full Text Sources