

Temporal dynamics of cholinergic activity in the septo-hippocampal system
- PMID: 36092276
- PMCID: PMC9452968
- DOI: 10.3389/fncir.2022.957441
Temporal dynamics of cholinergic activity in the septo-hippocampal system
Abstract
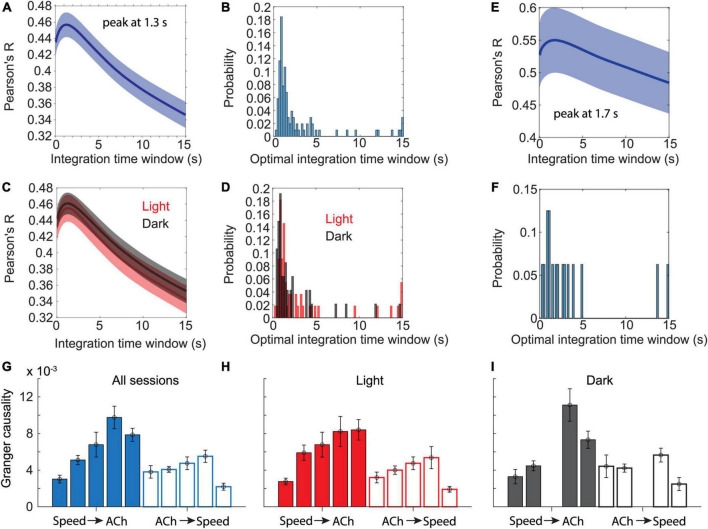
Cholinergic projection neurons in the medial septum and diagonal band of Broca are the major source of cholinergic modulation of hippocampal circuit functions that support neural coding of location and running speed. Changes in cholinergic modulation are known to correlate with changes in brain states, cognitive functions, and behavior. However, whether cholinergic modulation can change fast enough to serve as a potential speed signal in hippocampal and parahippocampal cortices and whether the temporal dynamics in such a signal depend on the presence of visual cues remain unknown. In this study, we use a fiber-photometric approach to quantify the temporal dynamics of cholinergic activity in freely moving mice as a function of the animal's movement speed and visual cues. We show that the population activity of cholinergic neurons in the medial septum and diagonal band of Broca changes fast enough to be aligned well with changes in the animal's running speed and is strongly and linearly correlated to the logarithm of the animal's running speed. Intriguingly, the cholinergic modulation remains strongly and linearly correlated to the speed of the animal's neck movements during periods of stationary activity. Furthermore, we show that cholinergic modulation is unaltered during darkness. Lastly, we identify rearing, a stereotypic behavior where the mouse stands on its hindlimbs to scan the environment from an elevated perspective, is associated with higher cholinergic activity than expected from neck movements on the horizontal plane alone. Taken together, these data show that temporal dynamics in the cholinergic modulation of hippocampal circuits are fast enough to provide a potential running speed signal in real-time. Moreover, the data show that cholinergic modulation is primarily a function of the logarithm of the animal's movement speed, both during locomotion and during stationary activity, with no significant interaction with visual inputs. These data advance our understanding of temporal dynamics in cholinergic modulation of hippocampal circuits and their functions in the context of neural coding of location and running speed.
Keywords: acetylcholine; darkness; entorhinal cortex; fiber photometry; hippocampus; medial septum; running speed; temporal dynamics.
Copyright © 2022 Kopsick, Hartzell, Lazaro, Nambiar, Hasselmo and Dannenberg.
Conflict of interest statement
The authors declare that the research was conducted in the absence of any commercial or financial relationships that could be construed as a potential conflict of interest.
Figures


Similar articles
-
Cholinergic dynamics in the septo-hippocampal system provide phasic multiplexed signals for spatial novelty and correlate with behavioral states.bioRxiv [Preprint]. 2025 Jan 21:2025.01.21.634097. doi: 10.1101/2025.01.21.634097. bioRxiv. 2025. PMID: 39896475 Free PMC article. Preprint.
-
The Firing Rate Speed Code of Entorhinal Speed Cells Differs across Behaviorally Relevant Time Scales and Does Not Depend on Medial Septum Inputs.J Neurosci. 2019 May 1;39(18):3434-3453. doi: 10.1523/JNEUROSCI.1450-18.2019. Epub 2019 Feb 25. J Neurosci. 2019. PMID: 30804092 Free PMC article.
-
Synergy of direct and indirect cholinergic septo-hippocampal pathways coordinates firing in hippocampal networks.J Neurosci. 2015 Jun 3;35(22):8394-410. doi: 10.1523/JNEUROSCI.4460-14.2015. J Neurosci. 2015. PMID: 26041909 Free PMC article.
-
Septo-hippocampal interaction.Cell Tissue Res. 2018 Sep;373(3):565-575. doi: 10.1007/s00441-017-2745-2. Epub 2017 Dec 18. Cell Tissue Res. 2018. PMID: 29250747 Free PMC article. Review.
-
Potential roles of cholinergic modulation in the neural coding of location and movement speed.J Physiol Paris. 2016 Sep;110(1-2):52-64. doi: 10.1016/j.jphysparis.2016.09.002. Epub 2016 Sep 24. J Physiol Paris. 2016. PMID: 27677935 Free PMC article. Review.
Cited by
-
Cholinergic modulation of rearing in rats performing a spatial memory task.Eur J Neurosci. 2024 May;59(9):2240-2255. doi: 10.1111/ejn.16248. Epub 2024 Jan 23. Eur J Neurosci. 2024. PMID: 38258622 Free PMC article.
-
Histamine H1 receptors in dentate gyrus-projecting cholinergic neurons of the medial septum suppress contextual fear retrieval in mice.Nat Commun. 2024 Jul 10;15(1):5805. doi: 10.1038/s41467-024-50042-4. Nat Commun. 2024. PMID: 38987240 Free PMC article.
-
A Continuous Attractor Model with Realistic Neural and Synaptic Properties Quantitatively Reproduces Grid Cell Physiology.Int J Mol Sci. 2024 May 31;25(11):6059. doi: 10.3390/ijms25116059. Int J Mol Sci. 2024. PMID: 38892248 Free PMC article.
-
Septo-hippocampal dynamics and the encoding of space and time.Trends Neurosci. 2023 Sep;46(9):712-725. doi: 10.1016/j.tins.2023.06.004. Epub 2023 Jul 19. Trends Neurosci. 2023. PMID: 37479632 Free PMC article. Review.
-
Cholinergic modulation shifts the response of CA1 pyramidal cells to depolarizing ramps via TRPM4 channels with potential implications for place field firing.Elife. 2023 Jul 5;12:e84387. doi: 10.7554/eLife.84387. Elife. 2023. PMID: 37404129 Free PMC article.
References
Publication types
MeSH terms
Substances
Grants and funding
LinkOut - more resources
Full Text Sources
Research Materials