. 2022 Aug 19:13:927935.
doi: 10.3389/fpls.2022.927935. eCollection 2022.

Coupling the environmental impacts of reactive nitrogen losses and yield responses of staple crops in China

Affiliations

Coupling the environmental impacts of reactive nitrogen losses and yield responses of staple crops in China

Ahmed I Abdo et al. Front Plant Sci. .

Abstract

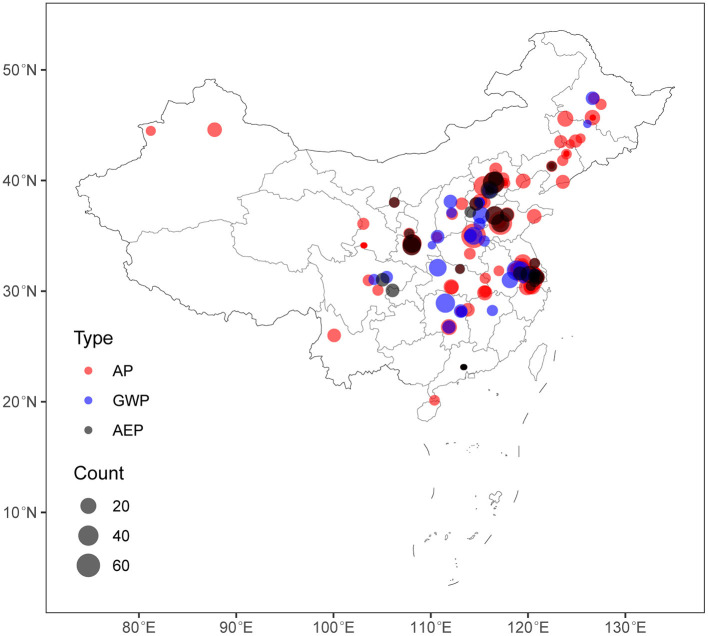
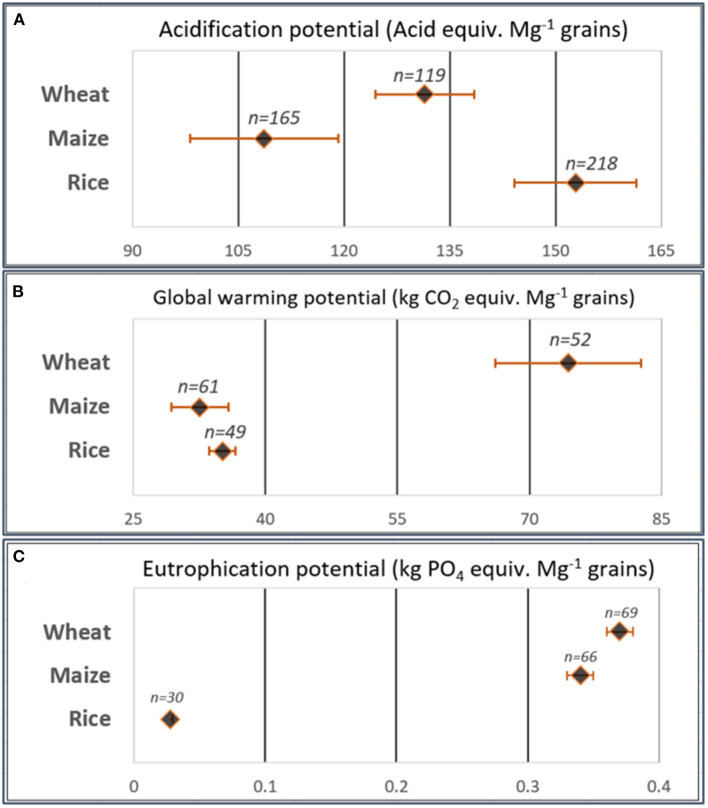
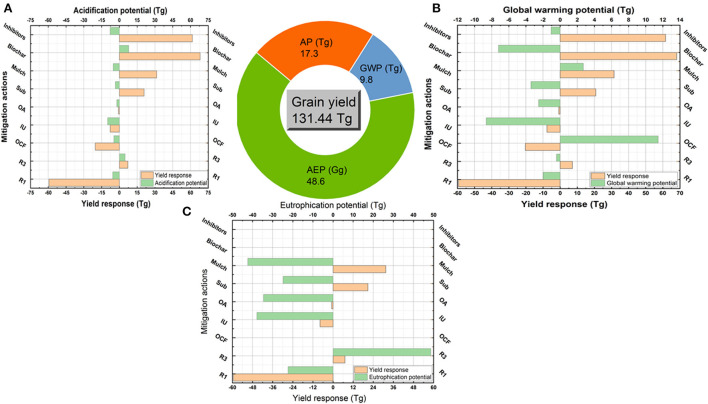
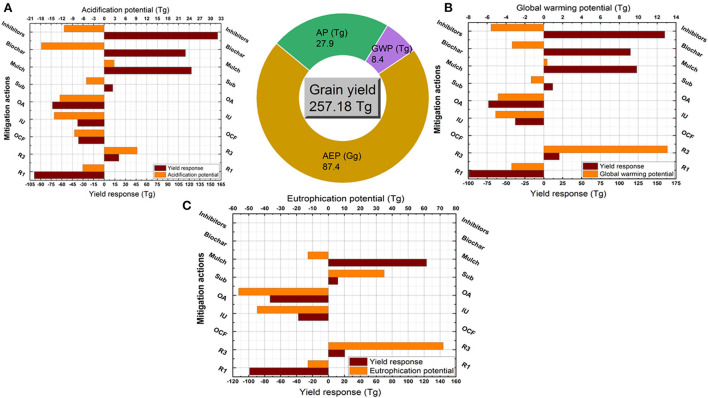
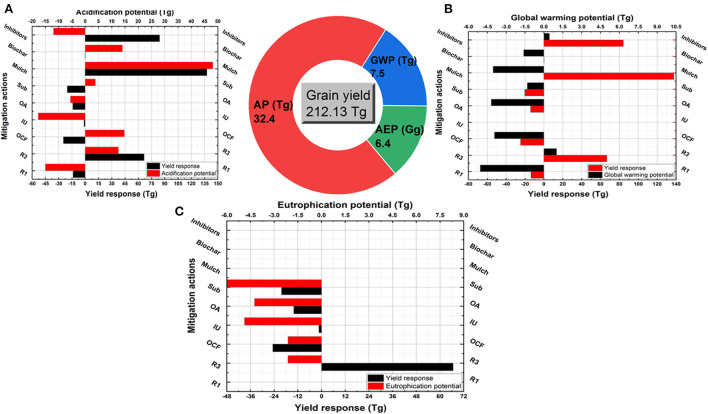
Cropland reactive nitrogen losses (Nr) are of the greatest challenges facing sustainable agricultural intensification to meet the increases in food demand. The environmental impacts of Nr losses and their yield responses to the mitigation strategies were not completely evaluated. We assessed the environmental impacts of Nr losses in China and coupled the efficiency of mitigation actions with yield responses. Datasets about Nr losses in China were collected, converted into potentials of acidification (AP), global warming (GWP), and aquatic eutrophication (AEP), and analyzed by a meta-analysis program. Results showed that producing 1 Mg of rice grains had the highest AP (153 kg acid equiv.), while wheat had the highest GWP and AEP (74 kg CO2 equiv. and 0.37 kg PO4 equiv., respectively). Using the conventional rates (averagely, 200, 230, and 215 kg N ha-1) of urea as a surface application to produce 131.4, 257.2, and 212.1 Tg of wheat, maize, and rice resulted in 17-33 Tg, 7-10 Tg, and 6-87 Gg of AP, GWP, and AEP, respectively. For their balanced effect on reducing AP, GWP, and AEP while maximizing yields, inhibitors, and subsurface application could be set as the best mitigation strategies in wheat production. Inhibitors usage and biochar are strongly recommended strategies for sustainable production of maize. None of the investigated strategies had a balanced effect on rice yield and the environment, thus new mitigation technologies should be developed.

Keywords: acidification; aquatic eutrophication; global warming; meta-analysis; mitigation strategies; nitrogen fertilizer.


Conflict of interest statement

The authors declare that the research was conducted in the absence of any commercial or financial relationships that could be construed as a potential conflict of interest.

Figures

Figure 1
Figure 1
Map of the dataset sites collected in this study. The symbol color indicates the type of environmental impact and the size indicates observations number within each site (n = 1,030 sites for AP, n = 398 sites for GWP, n = 365 sites for AEP). AP is air acidification potential (Acid equiv. Mg−1 grains), GWP is the global warming potential (kg CO2 equiv. Mg−1 grains) and AEP is the aquatic eutrophication potential (kg PO4 equiv. Mg−1 grains).
Figure 2
Figure 2
(A) The overall acidification potential (Acid equiv. Mg−1 grains), (B) global warming potential (kg CO2 equiv. Mg−1 grains) and (C) aquatic eutrophication potential (kg PO4 equiv. Mg−1 grains) resulted from the meta-analysis program. These are the pooled effect sizes of each group calculated using the observations received urea fertilizers at conventional rates (between 150–250, 200–260, and 170–260 kg N ha−1 for wheat, maize and rice, respectively) and applied as surface application without any amendments.
Figure 3
Figure 3
(A–I) Model-averaged importance of the drivers controlling the changes in overall AP, GWP, and AEP. The importance was calculated based on the sum of Akaike weights by the model selection using AICc. To differentiate between the unimportant and important drivers, we set 0.8 as the cutoff (dashed line). T is the overall temperatures during the growth season (°C). WL is the water load (mm) during season calculated by summation of precipitation (mm) and irrigation (mm). SOM is the soil organic matter content (g kg−1). STN is the soil total nitrogen (g kg−1) and clay is the soil clay content (g kg−1). The upper equations are mixed-effects meta-regression models at p < 0.05 and R2 is the relation strength.
Figure 4
Figure 4
Coupled yield production and environmental impacts in wheat crop. Pie chart refers to the total produced grains (Tg) under the conventional practices (using urea fertilizer at conventional rates with surface application and no amendments) and the total coupled AP (Tg Acid equiv.), GWP (Tg CO2 equiv.) and AEP (Gg PO4 equiv.). Column figures refer to the coupled changes in yield and AP (A), GWP (B), and AEP (C) as responded to each strategy. These strategies are reduced N rate (R1), increased N rate scenario (R3), other synthetic fertilizers (OCF), improved urea (IU, slow released fertilizers), organic sources (OA), subsurface application (Sub) and uses of mulch, biochar and inhibitors.
Figure 5
Figure 5
Coupled yield production and environmental impacts in maize crop. Pie chart refers to the total produced grains (Tg) under the conventional practices (using urea fertilizer at conventional rates with surface application and no amendments) and the total coupled AP (Tg Acid equiv.), GWP (Tg CO2 equiv.), and AEP (Gg PO4 equiv.). Column figures refer to the coupled changes in yield and AP (A), GWP (B), and AEP (C) as responded to each strategy. These strategies are reduced N rate (R1), increased N rate scenario (R3), other synthetic fertilizers (OCF), improved urea (IU, slow released fertilizers), organic sources (OA), subsurface application (Sub) and uses of mulch, biochar and inhibitors.
Figure 6
Figure 6
Coupled yield production and environmental impacts in rice crop. Pie chart refers to the total produced grains (Tg) under the conventional practices (using urea fertilizer at conventional rates with surface application and no amendments) and the total coupled AP (Tg Acid equiv.), GWP (Tg CO2 equiv.) and AEP (Gg PO4 equiv.). Column figures refer to the coupled changes in yield and AP (A), GWP (B), and AEP (C) as responded to each strategy. These strategies are reduced N rate (R1), increased N rate scenario (R3), other synthetic fertilizers (OCF), improved urea (IU, slow released fertilizers), organic sources (OA), subsurface application (Sub) and uses of mulch, biochar and inhibitors.

Similar articles

Cited by

References

    1. Abdo A. I., Shi D., Li J., Yang T., Wang L. (2020). Ammonia emission from staple crops in China as response to mitigation strategies and agronomic conditions: meta-analytic study. J. Cleaner Produc. 279:123835. 10.1016/j.jclepro.2020.123835 - DOI
    1. Adalibieke W., Zhan X., Cui X., Reis S., Winiwarter W., Zhou F. (2021). Decoupling between ammonia emission and crop production in China due to policy interventions. Global Change Biol. 27, 1–12. 10.1111/gcb.15847 - DOI - PubMed
    1. Barnard R., Leadley P. W., Hungate B. A. (2005). Global change, nitrification, and denitrification: a review. Global Biogeochem Cycles 19, 1–13. 10.1029/2004GB002282 - DOI
    1. Bodirsky B. L., Popp A., Lotze-Campen H., Dietrich J. P., Rolinski S., Weindl I., et al. . (2014). Reactive nitrogen requirements to feed the world in 2050 and potential to mitigate nitrogen pollution. Nat. Commun. 5:3858. 10.1038/ncomms4858 - DOI - PubMed
    1. Borenstein M., Hedges L. V., Higgins J. P. T., Rothstein H. R. (2009). Comprehensive Meta Analysis (Version 2.2.064). Englewood, NJ: Biostat.

Publication types