

The induced motion effect is a high-level visual phenomenon: Psychophysical evidence
- PMID: 36092511
- PMCID: PMC9459461
- DOI: 10.1177/20416695221118111
The induced motion effect is a high-level visual phenomenon: Psychophysical evidence
Abstract
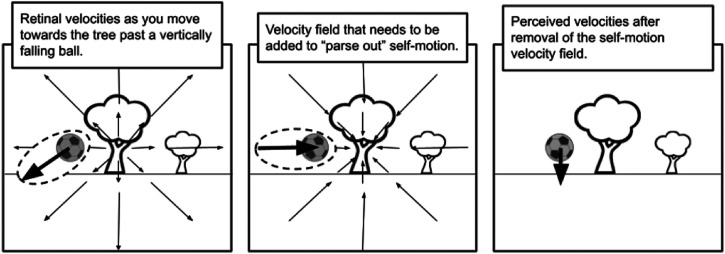
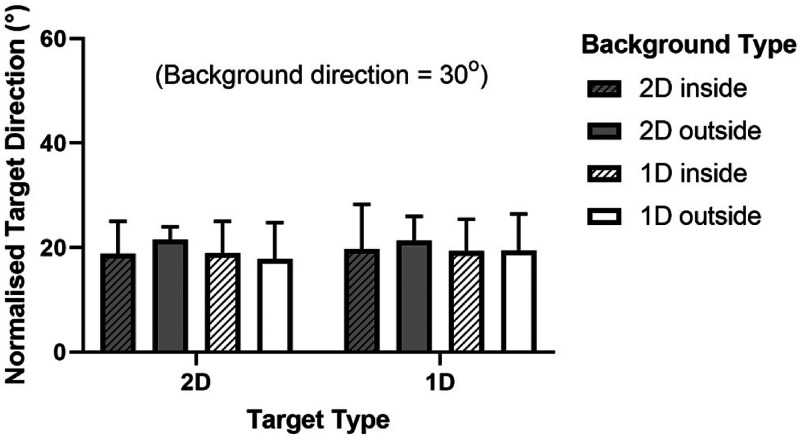
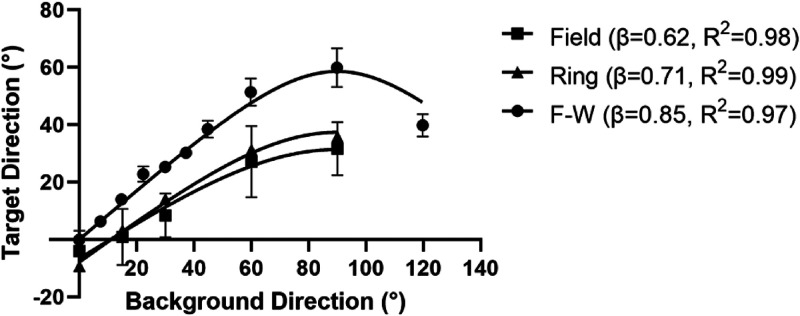
Induced motion is the illusory motion of a target away from the direction of motion of the unattended background. If it is a result of assigning background motion to self-motion and judging target motion relative to the scene as suggested by the flow parsing hypothesis then the effect must be mediated in higher levels of the visual motion pathway where self-motion is assessed. We provide evidence for a high-level mechanism in two broad ways. Firstly, we show that the effect is insensitive to a set of low-level spatial aspects of the scene, namely, the spatial arrangement, the spatial frequency content and the orientation content of the background relative to the target. Secondly, we show that the effect is the same whether the target and background are composed of the same kind of local elements-one-dimensional (1D) or two-dimensional (2D)-or one is composed of one, and the other composed of the other. The latter finding is significant because 1D and 2D local elements are integrated by two different mechanisms so the induced motion effect is likely to be mediated in a visual motion processing area that follows the two separate integration mechanisms. Area medial superior temporal in monkeys and the equivalent in humans is suggested as a viable site. We present a simple flow-parsing-inspired model and demonstrate a good fit to our data and to data from a previous induced motion study.
Keywords: higher-order motion; local motion; models; motion; neural mechanisms; optic flow; perception; perceptual organization; scene perception.
© The Author(s) 2022.
Conflict of interest statement
Declaration of Conflicting Interests: The authors declared no potential conflicts of interest with respect to the research, authorship, and/or publication of this article.
Figures


Similar articles
-
Target motion misjudgments reflect a misperception of the background; revealed using continuous psychophysics.Iperception. 2023 Dec 21;14(6):20416695231214439. doi: 10.1177/20416695231214439. eCollection 2023 Nov-Dec. Iperception. 2023. PMID: 38680843 Free PMC article.
-
Optic flow parsing in the macaque monkey.J Vis. 2020 Oct 1;20(10):8. doi: 10.1167/jov.20.10.8. J Vis. 2020. PMID: 33016983 Free PMC article.
-
Going with the Flow: The Neural Mechanisms Underlying Illusions of Complex-Flow Motion.J Neurosci. 2019 Apr 3;39(14):2664-2685. doi: 10.1523/JNEUROSCI.2112-18.2019. Epub 2019 Feb 18. J Neurosci. 2019. PMID: 30777886 Free PMC article.
-
Why do parallel cortical systems exist for the perception of static form and moving form?Percept Psychophys. 1991 Feb;49(2):117-41. doi: 10.3758/bf03205033. Percept Psychophys. 1991. PMID: 2017350 Review.
-
Hierarchical Vector Analysis of Visual Motion Perception.Annu Rev Vis Sci. 2025 Mar 31. doi: 10.1146/annurev-vision-110323-031344. Online ahead of print. Annu Rev Vis Sci. 2025. PMID: 40163902 Review.
Cited by
-
New insights and a computational model for understanding induced motion revealed through novel variants of the Flying Bluebottle Illusion.Iperception. 2025 Jun 17;16(3):20416695251344457. doi: 10.1177/20416695251344457. eCollection 2025 May-Jun. Iperception. 2025. PMID: 40538449 Free PMC article.
-
Continuous psychophysics for two-variable experiments; A new "Bayesian participant" approach.Iperception. 2023 Dec 21;14(6):20416695231214440. doi: 10.1177/20416695231214440. eCollection 2023 Nov-Dec. Iperception. 2023. PMID: 38690062 Free PMC article.
-
Target motion misjudgments reflect a misperception of the background; revealed using continuous psychophysics.Iperception. 2023 Dec 21;14(6):20416695231214439. doi: 10.1177/20416695231214439. eCollection 2023 Nov-Dec. Iperception. 2023. PMID: 38680843 Free PMC article.
References
LinkOut - more resources
Full Text Sources
