Machine learning analysis reveals abnormal functional network hubs in the primary angle-closure glaucoma patients
- PMID: 36092649
- PMCID: PMC9450012
- DOI: 10.3389/fnhum.2022.935213
Machine learning analysis reveals abnormal functional network hubs in the primary angle-closure glaucoma patients
Abstract
Background: Primary angle-closure glaucoma (PACG) is a serious and irreversible blinding eye disease. Growing studies demonstrated that PACG patients were accompanied by vision and vision-related brain region changes. However, whether the whole-brain functional network hub changes occur in PACG patients remains unknown.
Purpose: The purpose of the study was to investigate the brain function network hub changes in PACG patients using the voxel-wise degree centrality (DC) method.
Materials and methods: Thirty-one PACG patients (21 male and 10 female) and 31 healthy controls (HCs) (21 male and 10 female) closely matched in age, sex, and education were enrolled in the study. The DC method was applied to investigate the brain function network hub changes in PACG patients. Moreover, the support vector machine (SVM) method was applied to distinguish PACG patients from HC patients.
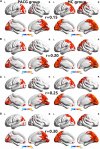
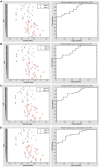
Results: Compared with HC, PACG patients had significantly higher DC values in the right fusiform, left middle temporal gyrus, and left cerebelum_4_5. Meanwhile, PACG patients had significantly lower DC values in the right calcarine, right postcentral gyrus, left precuneus gyrus, and left postcentral gyrus. Furthermore, the SVM classification reaches a total accuracy of 72.58%, and the ROC curve of the SVM classifier has an AUC value of 0.85 (r = 0.25).
Conclusion: Our results showed that PACG patients showed widespread brain functional network hub dysfunction relative to the visual network, auditory network, default mode network, and cerebellum network, which might shed new light on the neural mechanism of optic atrophy in PACG patients.
Keywords: PACG; SVM; brain network; degree centrality; fMRI.
Copyright © 2022 Chen, Zhong, Liu and Huang.
Conflict of interest statement
The authors declare that the research was conducted in the absence of any commercial or financial relationships that could be construed as a potential conflict of interest.
Figures


Similar articles
-
The Predictive Values of Changes in Local and Remote Brain Functional Connectivity in Primary Angle-Closure Glaucoma Patients According to Support Vector Machine Analysis.Front Hum Neurosci. 2022 May 19;16:910669. doi: 10.3389/fnhum.2022.910669. eCollection 2022. Front Hum Neurosci. 2022. PMID: 35664342 Free PMC article.
-
Machine Learning Analysis Classifies Patients with Primary Angle-Closure Glaucoma Using Abnormal Brain White Matter Function.Clin Ophthalmol. 2024 Mar 7;18:659-670. doi: 10.2147/OPTH.S451872. eCollection 2024. Clin Ophthalmol. 2024. PMID: 38468914 Free PMC article.
-
Frequency-dependent neural activity in primary angle-closure glaucoma.Neuropsychiatr Dis Treat. 2019 Jan 18;15:271-282. doi: 10.2147/NDT.S187367. eCollection 2019. Neuropsychiatr Dis Treat. 2019. PMID: 30697052 Free PMC article.
-
Disrupted interhemispheric functional connectivity in primary angle-closure glaucoma: a functional MRI study: voxel-mirrored homotopic connectivity in primary angle-closure glaucoma patients.Neuroreport. 2022 Oct 5;33(14):604-611. doi: 10.1097/WNR.0000000000001823. Epub 2022 Aug 26. Neuroreport. 2022. PMID: 36062513
-
Network Centrality of Resting-State fMRI in Primary Angle-Closure Glaucoma Before and After Surgery.PLoS One. 2015 Oct 27;10(10):e0141389. doi: 10.1371/journal.pone.0141389. eCollection 2015. PLoS One. 2015. PMID: 26506229 Free PMC article.
Cited by
-
Impaired interhemispheric synchrony in patients with iridocyclitis and classification using machine learning: an fMRI study.Front Immunol. 2024 Dec 16;15:1474988. doi: 10.3389/fimmu.2024.1474988. eCollection 2024. Front Immunol. 2024. PMID: 39737192 Free PMC article.
-
Topological Organization of the Brain Network in Patients with Primary Angle-closure Glaucoma Through Graph Theory Analysis.Brain Topogr. 2024 Nov;37(6):1171-1185. doi: 10.1007/s10548-024-01060-4. Epub 2024 Jun 1. Brain Topogr. 2024. PMID: 38822211
-
Glaucoma and brain functional networks: a bidirectional Mendelian randomisation study.BMJ Open Ophthalmol. 2025 Apr 12;10(1):e001902. doi: 10.1136/bmjophth-2024-001902. BMJ Open Ophthalmol. 2025. PMID: 40221145 Free PMC article.
-
Disrupted dynamic amplitude of low-frequency fluctuations in patients with active thyroid-associated ophthalmopathy.Front Cell Dev Biol. 2023 May 12;11:1174688. doi: 10.3389/fcell.2023.1174688. eCollection 2023. Front Cell Dev Biol. 2023. PMID: 37250893 Free PMC article.
-
Altered static and dynamic functional network connectivity in primary angle-closure glaucoma patients.Sci Rep. 2024 May 22;14(1):11682. doi: 10.1038/s41598-024-62635-6. Sci Rep. 2024. PMID: 38778225 Free PMC article.
References
LinkOut - more resources
Full Text Sources

