

Welfare of equidae during transport
- PMID: 36092762
- PMCID: PMC9449990
- DOI: 10.2903/j.efsa.2022.7444
Welfare of equidae during transport
Abstract
In the framework of its Farm to Fork Strategy, the Commission is undertaking a comprehensive evaluation of animal welfare legislation. This opinion deals with the protection of horses and donkeys during transport. While the opinion focuses primarily on road transport of horses, there are specific sections dealing with the transport of horses on roll-on-roll-off ferries, horses transported by air and the transport of donkeys. In addition, the opinion covers welfare concerns in relation to a specific scenario identified by the European Commission related to the transport of horses on long journeys to slaughterhouses. Current practices related to transport of horses during the different stages (preparation, loading and unloading, transit and the journey breaks) are described. Overall, 13 welfare consequences were identified as being highly relevant for the welfare of horses during transport based on severity, duration and frequency of occurrence: gastro-enteric disorders, handling stress, heat stress, injuries, isolation stress, motion stress, prolonged hunger, prolonged thirst, respiratory disorders, resting problems, restriction of movement, sensory overstimulation and separation stress. These welfare consequences and their animal-based measures are described. A variety of hazards were identified related to factors such as inexperienced/untrained handlers, lack of horse training, structural deficiencies of vehicles/facilities, poor driving skills/conditions, horse separation/regrouping, unfavourable microclimatic and environmental conditions and poor husbandry practices. The opinion contains general and specific conclusions in relation to the different stages of transport. Recommendations to prevent hazards and correct or mitigate welfare consequences have been developed. Recommendations were also developed to define quantitative thresholds for microclimatic conditions within the means of transport and for space allowance. The development of welfare consequences over time was assessed in relation to maximum journey time.
Keywords: Farm to Fork Strategy; Horse; animal welfare; animal‐based measures; quantitative thresholds; transport; welfare consequences.
© 2022 Wiley‐VCH Verlag GmbH & Co. KgaA on behalf of the European Food Safety Authority.
Figures


LCT/A: Lower critical temperature (LCT), UCT/D: Upper critical temperature; B: Lower limit of thermal comfort zone; C: Upper limit of thermal comfort zone.


The horses were exposed to the following temperature levels, with relative humidity in brackets: –3°C (50%); 6°C (55%); 15°C (55%); 20°C (45%); 30°C (40%) and 37°C (40%) as measured during a 1.5‐h stay in a climatic chamber. The temperature inside the climate chamber is shown on the X‐axis, and the rate of total heat loss (Wm–2)


The horses were kept in forward‐facing individual stalls of unspecified size, and no food or water was provided. Dotted lines parallel to x‐axis indicate journey duration.

The horses were kept in forward‐facing individual stalls of unspecified size, and no food or water was provided. The arrow indicates day of transport.

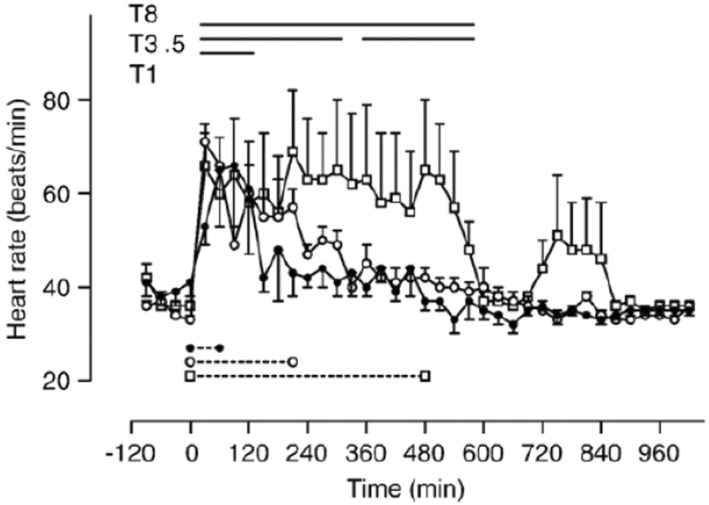
The x‐axis indicate minutes during two occasions of a 2‐day (1,370 km) journey separated by 8 days. The horses were transported for 24 h on days 1 and 11, and for 20 h on days 2 and 10. During the journeys, horses were not fed but received water during stops at 4‐ to 5‐h intervals. The horses were kept in stalls of 75 × 205 cm, oriented at 75o to the direction of the movement of the vehicle.


References
-
- AAWSG (Australian Animal Welfare Standards and Guidelines) , 2012. Land transport of livestock. Available online: https://www.animalwelfarestandards.net.au/files/2021/06/Land-transport-o...
-
- Ainsworth DM and Hackett RP, 2004. Disorders of the respiratory system. Equine Internal Medicine, 289–353. 10.1016/B0-72-169777-1/50009-3 - DOI
-
- Ake AS, Ayo JO and Aluwong T, 2013. Effects of transportation and thermal stress on donkeys in the Northern Guinea Savannah zone of Nigeria: a review. Journal of Cell and Animal Biology. Available online: 10.5897/JCAB2013.0370 - DOI
-
- Allano M, Labrecque O, Batista ER, Beauchamp G, Bédard C, Lavoie JP and Leclere M, 2016. Influence of short distance transportation on tracheal bacterial content and lower airway cytology in horses. The Veterinary Journal, 214, 47–49. - PubMed