

A Simple Nomogram for Predicting Osteoarthritis Severity in Patients with Knee Osteoarthritis
- PMID: 36092788
- PMCID: PMC9462991
- DOI: 10.1155/2022/3605369
A Simple Nomogram for Predicting Osteoarthritis Severity in Patients with Knee Osteoarthritis
Abstract
Objective: To explore the influencing factors of knee osteoarthritis (KOA) severity and establish a KOA nomogram model.
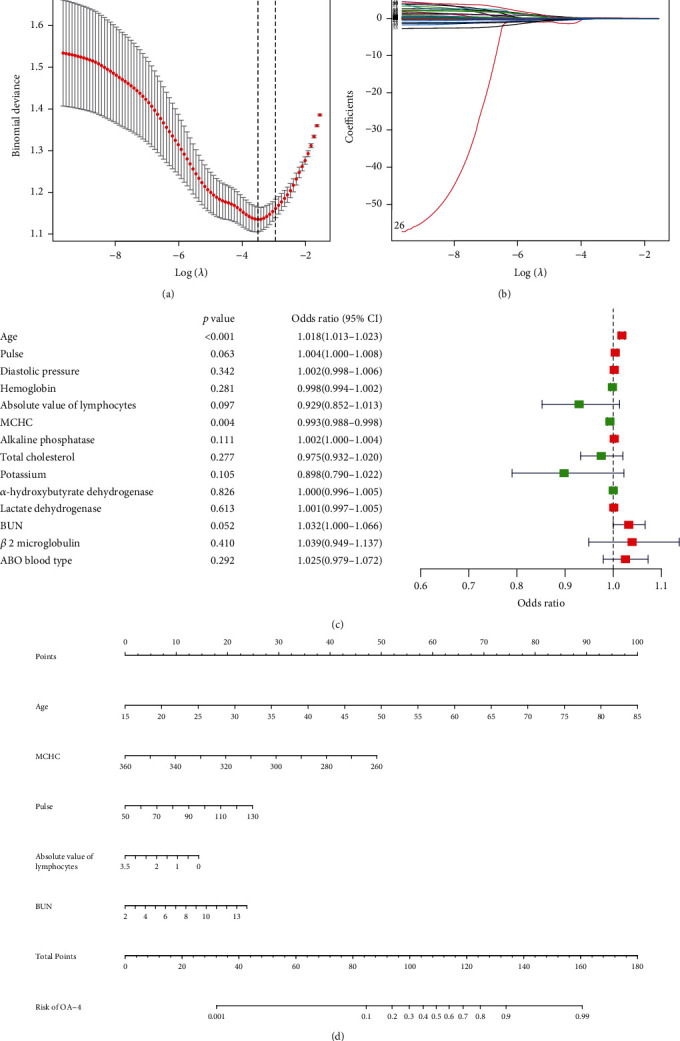
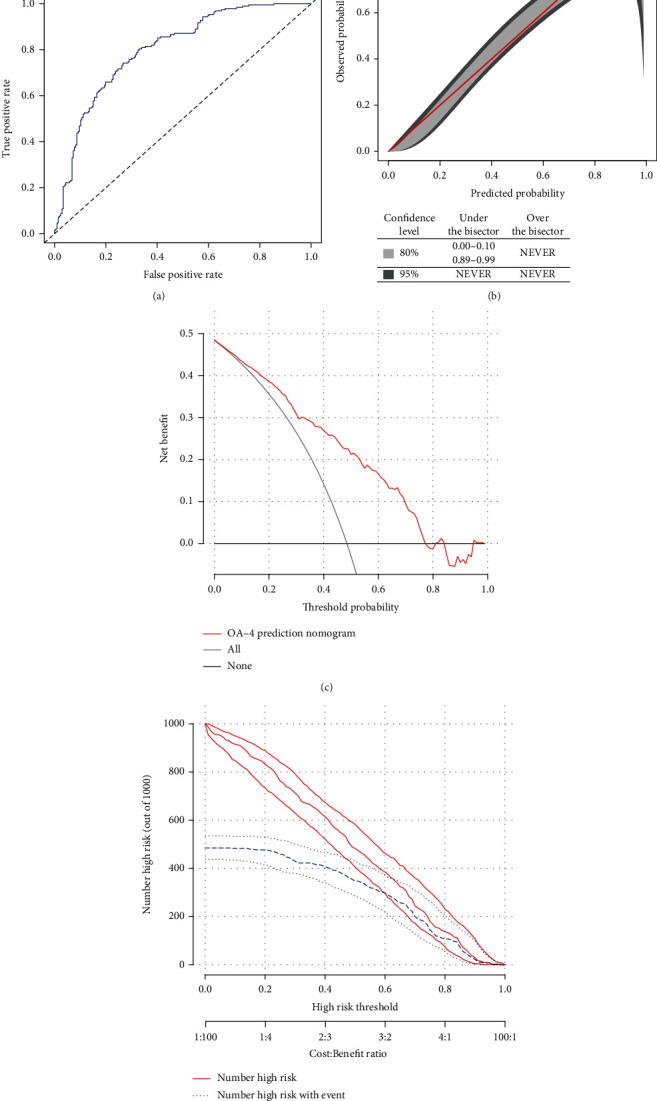
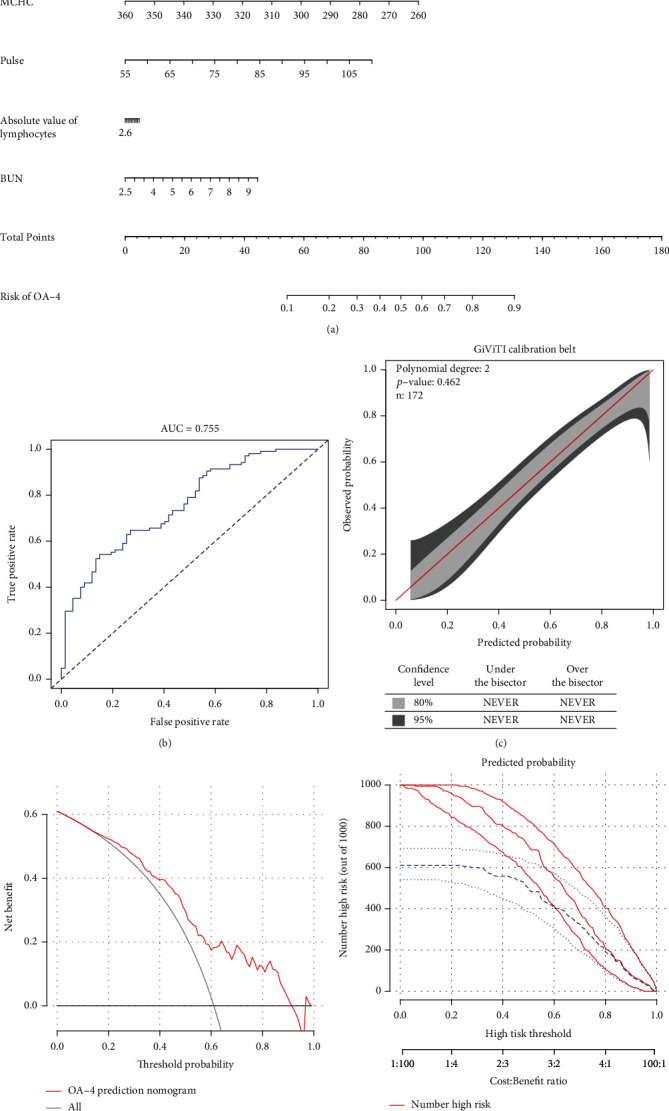
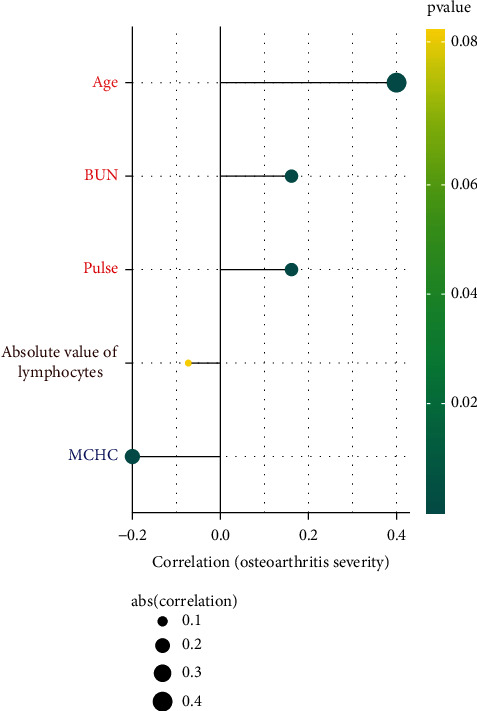
Methods: Inpatient data collected in the Department of Joint Surgery, Chengde Medical University Affiliated Hospital from January 2020 to January 2022 were used as the training cohort. Patients with knee osteoarthritis who were admitted to the Third Hospital of Hebei Medical University from February 2022 to May 2022 were taken as the external validation group of the model. In the training group, the least absolute shrinkage and selection operator (LASSO) method was used to screen the factors of KOA severity to determine the best prediction index. Then, after combining the significant factors from the LASSO and multivariate logistic regressions, a prediction model was established. All potential prediction factors were included in the KOA severity prediction model, and the corresponding nomogram was drawn. The consistency index (C-index), area under the receiver operating characteristic (ROC) curve (AUC), GiViTi calibration band, net classification improvement (NRI) index, and integrated discrimination improvement (IDI) index evaluation of a model predicted KOA severity. Decision curve analysis (DCA) and clinical influence curves were used to study the model's potential clinical value. The validation group also used the above evaluation indexes to measure the diagnostic efficiency of the model. Spearman correlation was used to investigate the relationship between nomogram-related markers and osteoarthritis severity.
Results: The total sample included 572 patients with knee osteoarthritis, including 400 patients in the training cohort and 172 patients in the validation cohort. The nomogram's predictive factors were age, pulse, absolute value of lymphocytes, mean corpuscular haemoglobin concentration (MCHC), and blood urea nitrogen (BUN). The C-index and AUC of the model were 0.802. The GiViTi calibration band (P = 0.065), NRI (0.091), and IDI (0.033) showed that the modified model can distinguish between severe KOA and nonsevere KOA. DCA showed that the KOA severity nomogram has clinical application value with threshold probabilities between 0.01 and 0.78. The external verification results also show the stability and diagnosis of the model. Age, pulse, MCHC, and BUN are correlated with osteoarthritis severity.
Conclusions: A nomogram model for predicting KOA severity was established for the first time that can visually identify patients with severe KOA and is novel for indirectly evaluating KOA severity by nonimaging means.
Copyright © 2022 Qingzhu Zhang et al.
Conflict of interest statement
The authors declare that they have no competing interests.
Figures
Similar articles
-
A Retrospective Study of Biological Risk Factors Associated with Primary Knee Osteoarthritis and the Development of a Nomogram Model.Int J Gen Med. 2024 Apr 9;17:1405-1417. doi: 10.2147/IJGM.S454664. eCollection 2024. Int J Gen Med. 2024. PMID: 38617053 Free PMC article.
-
The development of a clinical nomogram to predict medication nonadherence in patients with knee osteoarthritis.Medicine (Baltimore). 2023 Aug 4;102(31):e34481. doi: 10.1097/MD.0000000000034481. Medicine (Baltimore). 2023. PMID: 37543833 Free PMC article.
-
A nomogram based on radiological features of MRI for predicting the risk of severe pain in patients with osteoarthritis of the knee.Front Surg. 2023 Feb 8;10:1030164. doi: 10.3389/fsurg.2023.1030164. eCollection 2023. Front Surg. 2023. PMID: 36843982 Free PMC article.
-
Development and validation of a three-dimensional nomogram prediction model for knee osteoarthritis in middle-aged population.J Orthop Surg Res. 2024 Dec 23;19(1):866. doi: 10.1186/s13018-024-05349-9. J Orthop Surg Res. 2024. PMID: 39710717 Free PMC article.
-
Magnetic resonance imaging-based biomarkers for knee osteoarthritis outcomes: A narrative review of prediction but not association studies.Eur J Radiol. 2024 Dec;181:111731. doi: 10.1016/j.ejrad.2024.111731. Epub 2024 Sep 10. Eur J Radiol. 2024. PMID: 39276401 Review.
Cited by
-
A Retrospective Study of Biological Risk Factors Associated with Primary Knee Osteoarthritis and the Development of a Nomogram Model.Int J Gen Med. 2024 Apr 9;17:1405-1417. doi: 10.2147/IJGM.S454664. eCollection 2024. Int J Gen Med. 2024. PMID: 38617053 Free PMC article.
-
The development of a clinical nomogram to predict medication nonadherence in patients with knee osteoarthritis.Medicine (Baltimore). 2023 Aug 4;102(31):e34481. doi: 10.1097/MD.0000000000034481. Medicine (Baltimore). 2023. PMID: 37543833 Free PMC article.
-
A clinical model to predict the progression of knee osteoarthritis: data from Dryad.J Orthop Surg Res. 2023 Aug 28;18(1):628. doi: 10.1186/s13018-023-04118-4. J Orthop Surg Res. 2023. PMID: 37635226 Free PMC article. Clinical Trial.
-
Development and evaluation of nomograms for predicting osteoarthritis progression based on MRI cartilage parameters: data from the FNIH OA biomarkers Consortium.BMC Med Imaging. 2023 Mar 27;23(1):43. doi: 10.1186/s12880-023-01001-w. BMC Med Imaging. 2023. PMID: 36973670 Free PMC article.
-
Construction of a diagnostic model for osteoarthritis based on transcriptomic immune-related genes.Heliyon. 2023 Dec 13;10(1):e23636. doi: 10.1016/j.heliyon.2023.e23636. eCollection 2024 Jan 15. Heliyon. 2023. PMID: 38187306 Free PMC article.
References
MeSH terms
LinkOut - more resources
Full Text Sources
