

Risk tradeoffs between nitrogen dioxide and ozone pollution during the COVID-19 lockdowns in the Greater Bay area of China
- PMID: 36092859
- PMCID: PMC9446283
- DOI: 10.1016/j.apr.2022.101549
Risk tradeoffs between nitrogen dioxide and ozone pollution during the COVID-19 lockdowns in the Greater Bay area of China
Abstract
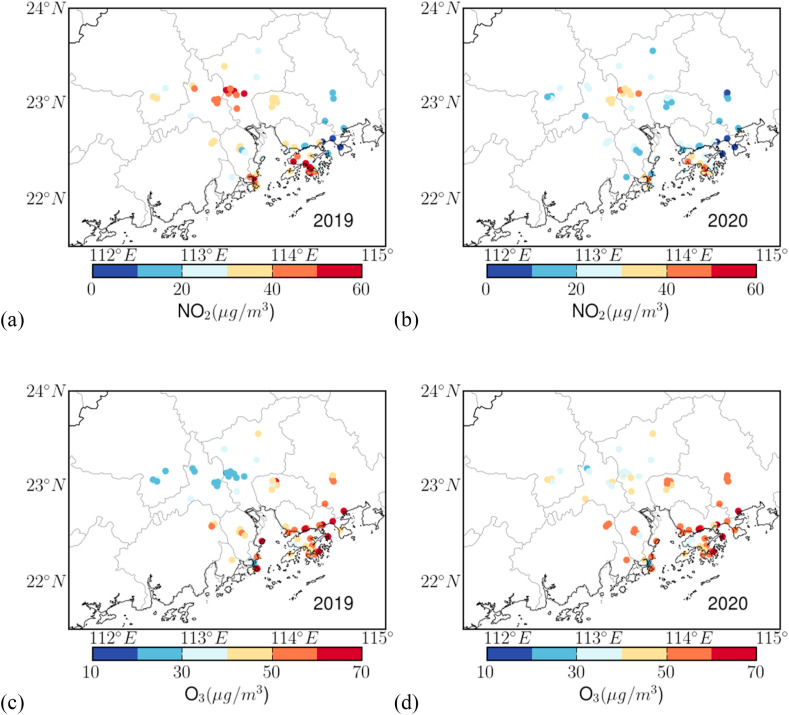
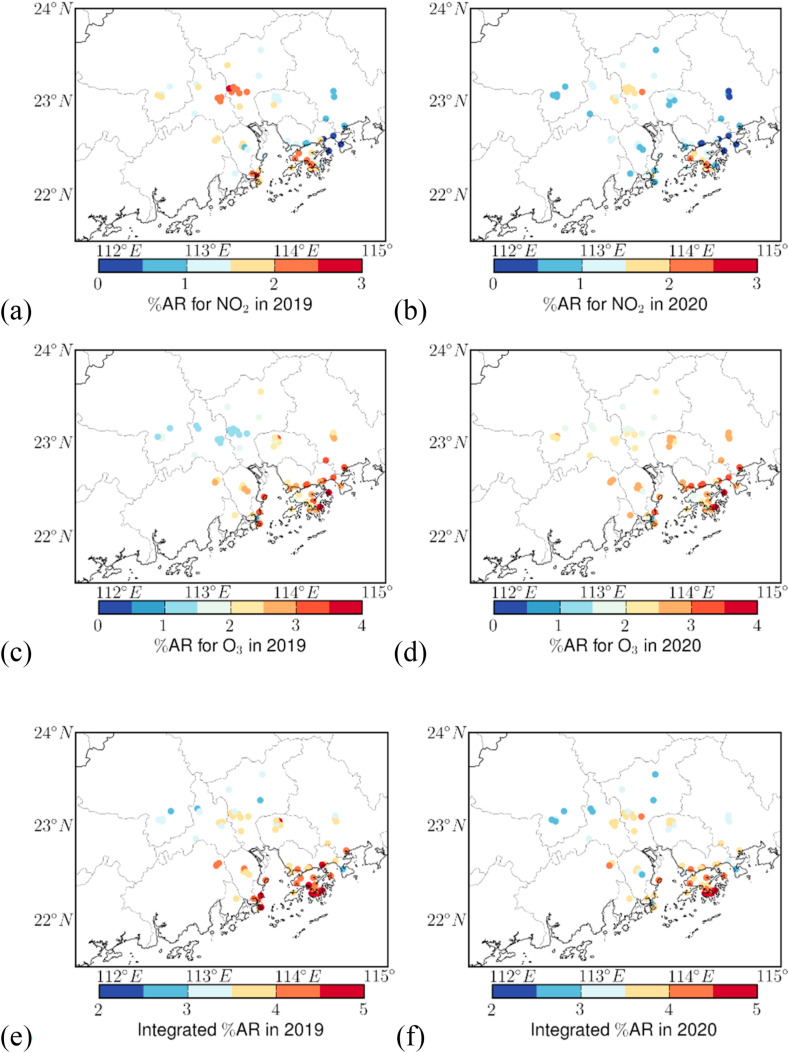
Photochemical regime for ozone (O3) formation is complicated in the sense that reducing emission of nitrogen oxides (NOx) may increase O3 concentration. The lockdown due to COVID-19 pandemic affords a unique opportunity to use real observations to explore the O3 formation regime and the effectiveness of NOx emission control strategies. In this study, observations from ground networks during the lockdowns were used to assess spatial disparity of the Ratio of Ozone Formation (ROF) for nitrogen dioxide (NO2) reduction in the Greater Bay Area (GBA) of China. The health risk model from Air Quality Health Index (AQHI) system in Hong Kong was adopted to evaluate the risk tradeoffs between NO2 and O3. Results show that the levels of O3 increase and NO2 reduction were comparable due to high ROF values in urban areas of central GBA. The ozone reactivity to NO2 reduction gradually declined outwards from central GBA. Despite the O3 increases, the NOx emission controls reduced the Integrated Health Risk (IHR) of NO2 and O3 in most regions of the GBA. When risk coefficients from the AQHI in Canada or the global review were adopted in the risk analyses, the results are extremely encouraging because the controls of NOx emission reduced the IHR of NO2 and O3 almost everywhere in the GBA. Our results underscore the importance of using a risk-based method to assess the effectiveness of emission control measures and the overall health benefit from NOx emission controls in the GBA.
Keywords: Emission; Health risk; Lockdowns; Nitrogen dioxide; Ozone.
© 2022 Turkish National Committee for Air Pollution Research and Control. Production and hosting by Elsevier B.V. All rights reserved.
Conflict of interest statement
The authors declare that they have no known competing financial interests or personal relationships that could have appeared to influence the work reported in this paper.
Figures


Similar articles
-
Combined effects of increased O3 and reduced NO2 concentrations on short-term air pollution health risks in Hong Kong.Environ Pollut. 2021 Feb 1;270:116280. doi: 10.1016/j.envpol.2020.116280. Epub 2020 Dec 13. Environ Pollut. 2021. PMID: 33360064
-
Impact of NOx reduction on long-term surface ozone pollution in roadside and suburban Hong Kong: Field measurements and model simulations.Chemosphere. 2022 Sep;302:134816. doi: 10.1016/j.chemosphere.2022.134816. Epub 2022 May 4. Chemosphere. 2022. PMID: 35525456
-
Assessing the intra-urban variability of nitrogen oxides and ozone across a highly heterogeneous urban area.Environ Monit Assess. 2021 Sep 17;193(10):657. doi: 10.1007/s10661-021-09414-2. Environ Monit Assess. 2021. PMID: 34533645
-
The impact of COVID-19 lockdown on air pollution in Europe and North America: a systematic review.Eur J Public Health. 2022 Nov 29;32(6):962-968. doi: 10.1093/eurpub/ckac118. Eur J Public Health. 2022. PMID: 36074061 Free PMC article.
-
Trends in urban air pollution over the last two decades: A global perspective.Sci Total Environ. 2023 Feb 1;858(Pt 2):160064. doi: 10.1016/j.scitotenv.2022.160064. Epub 2022 Nov 8. Sci Total Environ. 2023. PMID: 36356738 Review.
References
-
- Bosilovich M.G. A comparison of MODIS land surface temperature with in situ observations. Geophys. Res. Lett. 2006;33 doi: 10.1029/2006GL027519. - DOI
-
- Che W., Frey H.C., Fung J.C.H., Ning Z., Qu H., Lo H.K., Chen L., Wong T.-W., Wong M.K.M., Lee O.C.W., Carruthers D., Cheung F., Chan J.W.M., Yeung D.W., Fung Y.H., Zhang X., Stocker J., Hood C., Hohenberger T.L., Leung K.W., Louie P.Y.K., Li A.T.Y., Sun L., Wei P., Li Z., Zhang Y., Wang M., Shen Q., Huang W., Lee E., Patwary A., Lei X., Cheng S., Shakhaoat Hossain M., Tang K.T.J., Lao X., Leung R., Chan D., Li Y., Yuan Z., Lau A.K.H. PRAISE-HK: a personalized real-time air quality informatics system for citizen participation in exposure and health risk management. Sustain. Cities Soc. 2020;54 doi: 10.1016/j.scs.2019.101986. - DOI
-
- Ding A.J., Fu C.B., Yang X.Q., Sun J.N., Zheng L.F., Xie Y.N., Herrmann E., Nie W., Petäjä T., Kerminen V.-M., Kulmala M. Ozone and fine particle in the western Yangtze River Delta: an overview of 1 yr data at the SORPES station. Atmos. Chem. Phys. 2013;13:5813–5830. doi: 10.5194/acp-13-5813-2013. - DOI
LinkOut - more resources
Full Text Sources