

Nine-gene signature and nomogram for predicting survival in patients with head and neck squamous cell carcinoma
- PMID: 36092911
- PMCID: PMC9449318
- DOI: 10.3389/fgene.2022.927614
Nine-gene signature and nomogram for predicting survival in patients with head and neck squamous cell carcinoma
Abstract
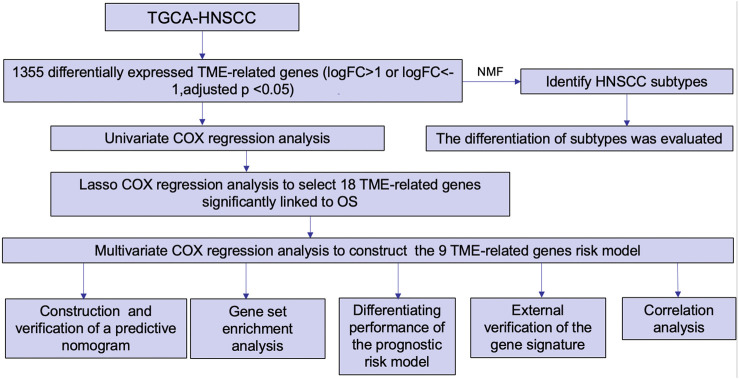
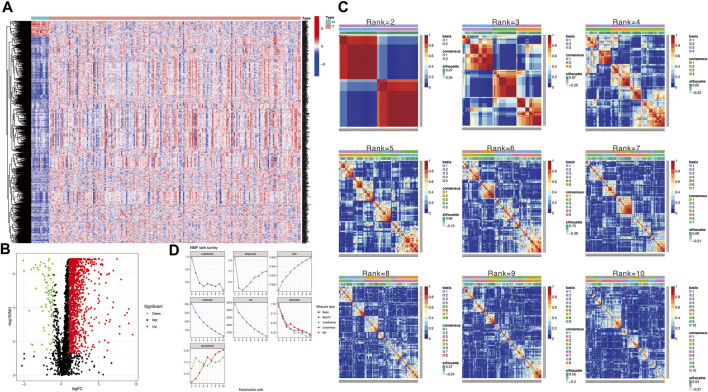
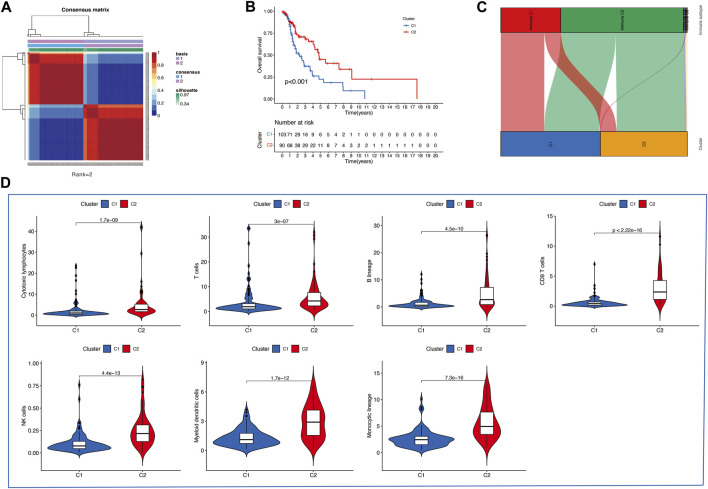
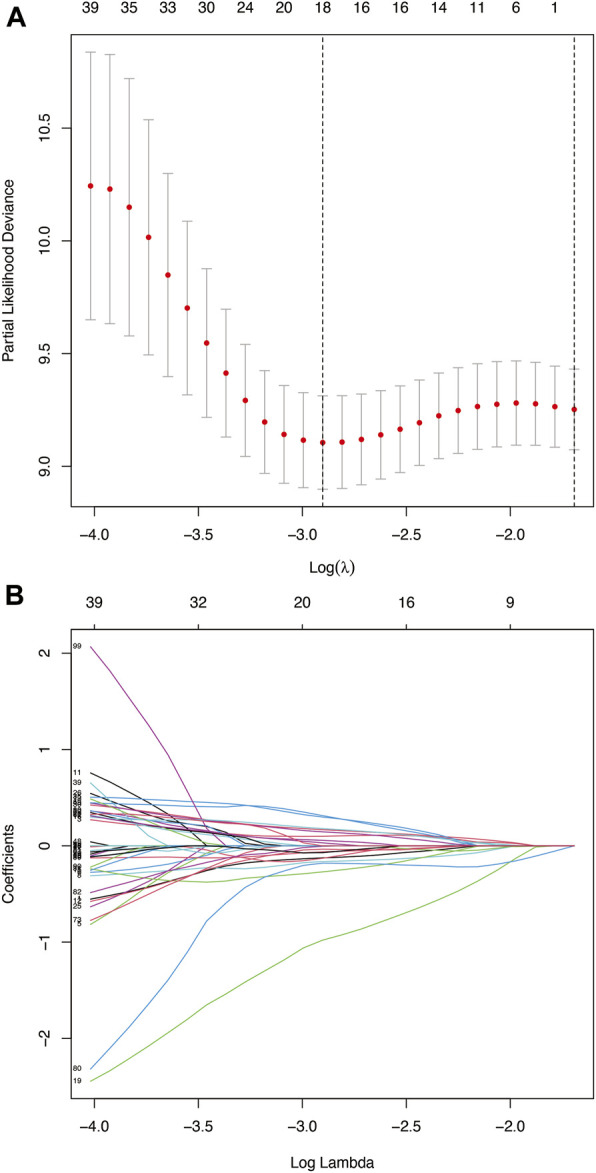
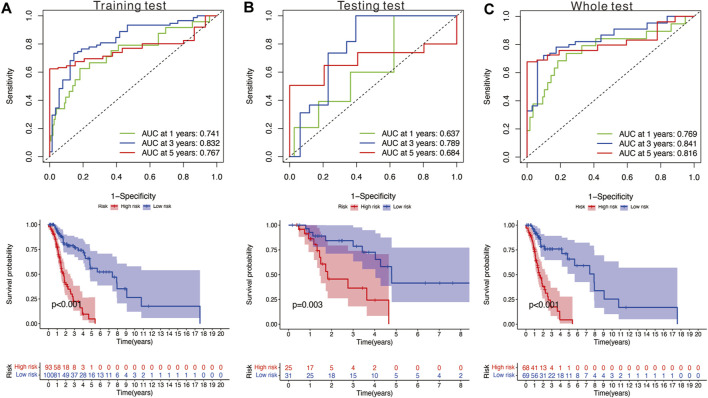
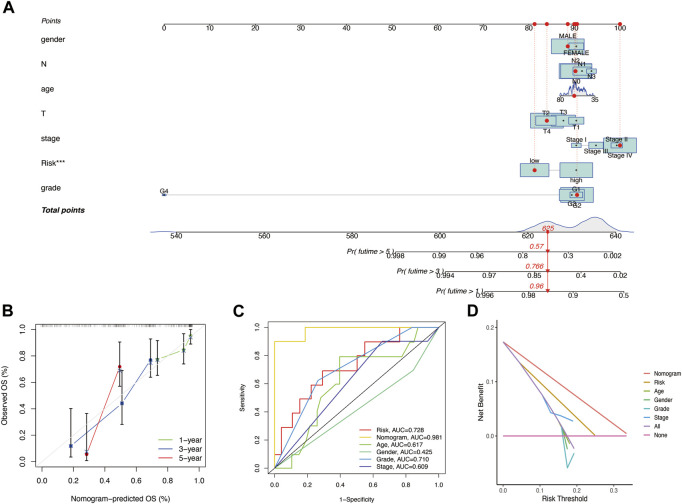
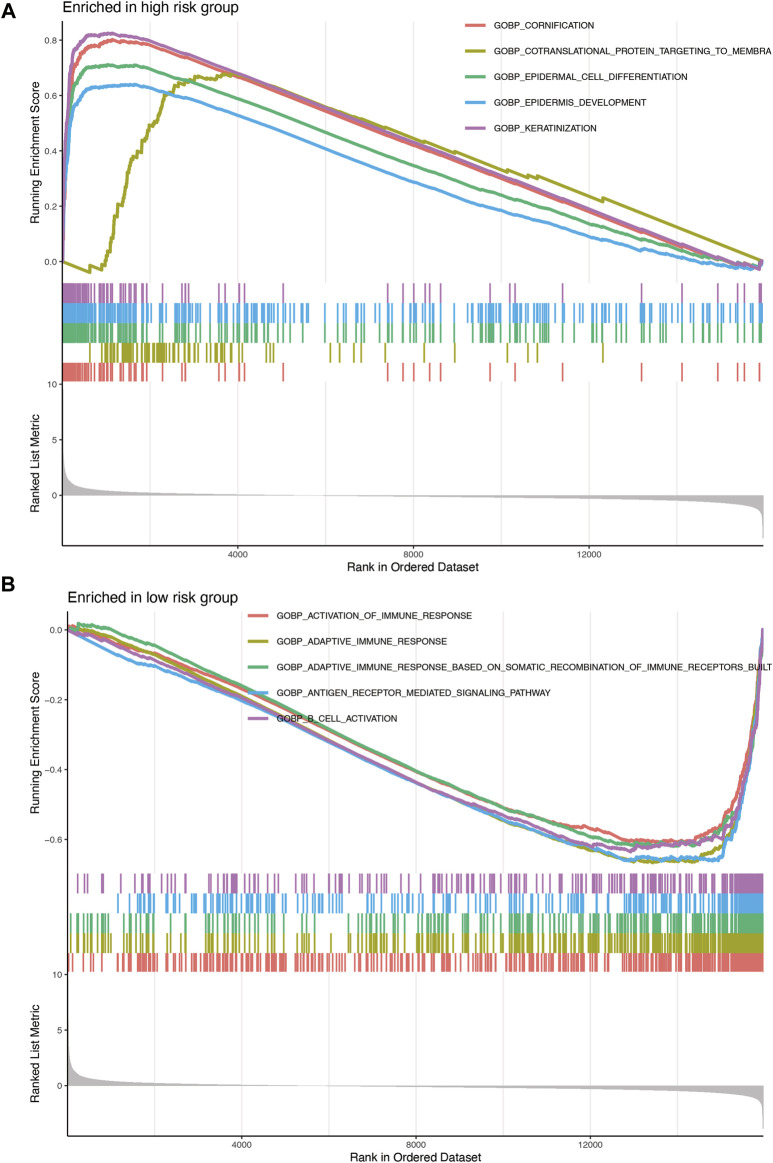
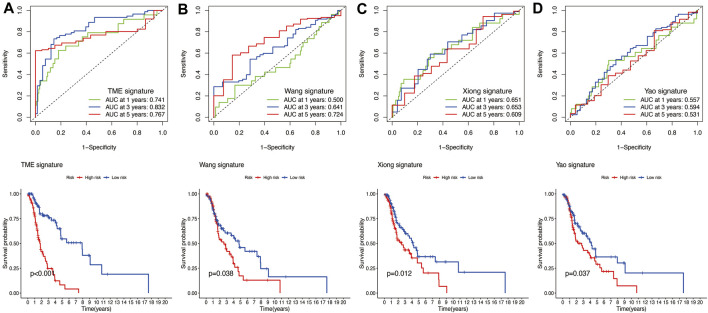
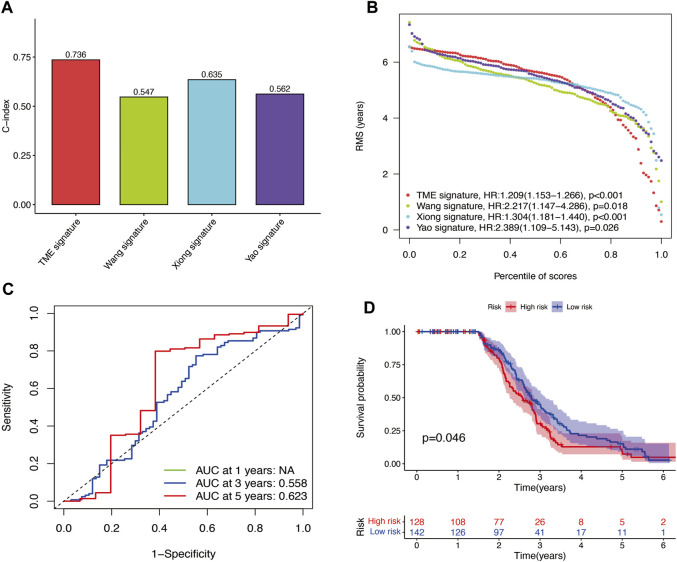
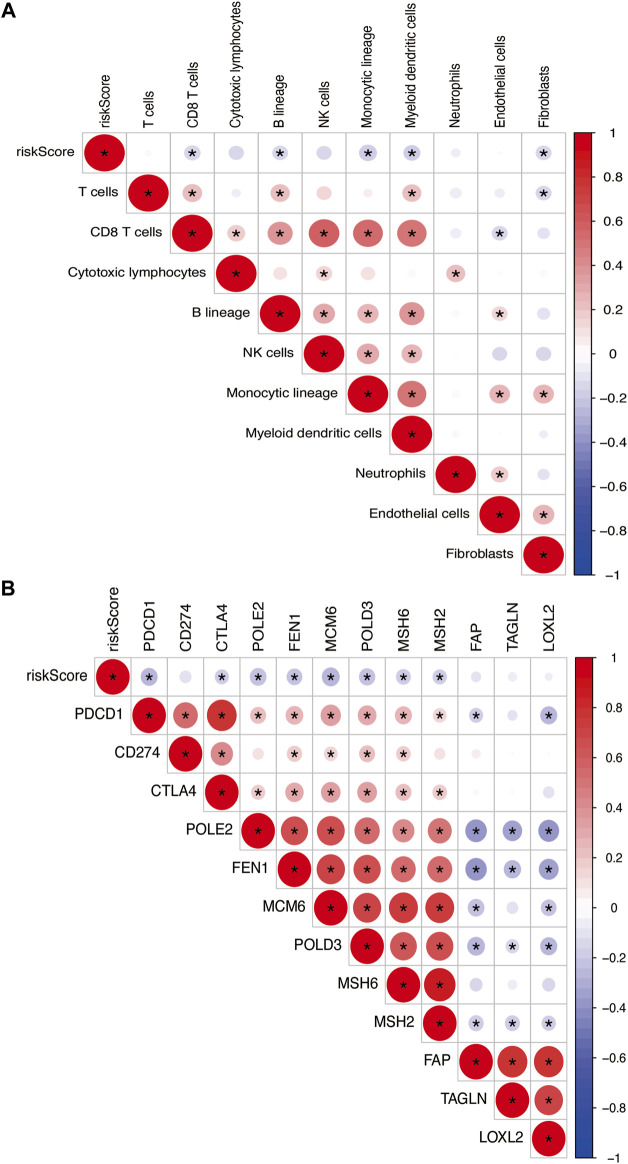
Background: Head and neck squamous cell carcinomas (HNSCCs) are derived from the mucosal linings of the upper aerodigestive tract, salivary glands, thyroid, oropharynx, larynx, and hypopharynx. The present study aimed to identify the novel genes and pathways underlying HNSCC. Despite the advances in HNSCC research, diagnosis, and treatment, its incidence continues to rise, and the mortality of advanced HNSCC is expected to increase by 50%. Therefore, there is an urgent need for effective biomarkers to predict HNSCC patients' prognosis and provide guidance to the personalized treatment. Methods: Both HNSCC clinical and gene expression data were abstracted from The Cancer Genome Atlas (TCGA) database. Intersecting analysis was adopted between the gene expression matrix of HNSCC patients from TCGA database to extract TME-related genes. Differential gene expression analysis between HNSCC tissue samples and normal tissue samples was performed by R software. Then, HNSCC patients were categorized into clusters 1 and 2 via NMF. Next, TME-related prognosis genes (p < 0.05) were analyzed by univariate Cox regression analysis, LASSO Cox regression analysis, and multivariate Cox regression analysis. Finally, nine genes were selected to construct a prognostic risk model and a prognostic gene signature. We also established a nomogram using relevant clinical parameters and a risk score. The Kaplan-Meier curve, survival analysis, time-dependent receiver operating characteristic (ROC) analysis, decision curve analysis (DCA), and the concordance index (C-index) were carried out to assess the accuracy of the prognostic risk model and nomogram. Potential molecular mechanisms were revealed by gene set enrichment analysis (GSEA). Additionally, gene correlation analysis and immune cell correlation analysis were conducted for further enriching our results. Results: A novel HNSCC prognostic model was established based on the nine genes (GTSE1, LRRN4CL, CRYAB, SHOX2, ASNS, KRT23, ANGPT2, HOXA9, and CARD11). The value of area under the ROC curves (AUCs) (0.769, 0.841, and 0.816) in TCGA whole set showed that the model effectively predicted the 1-, 3-, and 5-year overall survival (OS). Results of the Cox regression assessment confirmed the nine-gene signature as a reliable independent prognostic factor in HNSCC patients. The prognostic nomogram developed using multivariate Cox regression analysis showed a superior C-index over other clinical signatures. Also, the calibration curve had a high level of concordance between estimated OS and the observed OS. This showed that its clinical net can precisely estimate the one-, three-, and five-year OS in HNSCC patients. The gene set enrichment analysis (GSEA) to some extent revealed the immune- and tumor-linked cascades. Conclusion: In conclusion, the TME-related nine-gene signature and nomogram can effectively improve the estimation of prognosis in patients with HNSCC.
Keywords: GEO; TCGA; bioinformatics analysis; gene signature; head and neck squamous cell carcinoma; prognosis.
Copyright © 2022 Yang, Zhou, Yang and Wang.
Conflict of interest statement
The authors declare that the research was conducted in the absence of any commercial or financial relationships that could be construed as a potential conflict of interest.
Figures
Similar articles
-
A model of seven immune checkpoint-related genes predicting overall survival for head and neck squamous cell carcinoma.Eur Arch Otorhinolaryngol. 2021 Sep;278(9):3467-3477. doi: 10.1007/s00405-020-06540-4. Epub 2021 Jan 15. Eur Arch Otorhinolaryngol. 2021. PMID: 33449165
-
Identification and verification of eight cancer-associated fibroblasts related genes as a prognostic signature for head and neck squamous cell carcinoma.Heliyon. 2023 Feb 28;9(3):e14003. doi: 10.1016/j.heliyon.2023.e14003. eCollection 2023 Mar. Heliyon. 2023. PMID: 36938461 Free PMC article.
-
Seven Immune-Related Genes' Prognostic Value and Correlation with Treatment Outcome in Head and Neck Squamous Cell Carcinoma.Mediators Inflamm. 2023 Apr 20;2023:8533476. doi: 10.1155/2023/8533476. eCollection 2023. Mediators Inflamm. 2023. PMID: 39282247 Free PMC article.
-
A Narrative Review of Prognostic Gene Signatures in Oral Squamous Cell Carcinoma Using LASSO Cox Regression.Biomedicines. 2025 Jan 8;13(1):134. doi: 10.3390/biomedicines13010134. Biomedicines. 2025. PMID: 39857718 Free PMC article. Review.
-
Phosphorus Metabolism-Related Genes Serve as Novel Biomarkers for Predicting Prognosis in Bladder Cancer: A Bioinformatics Analysis.Iran J Public Health. 2024 Sep;53(9):1935-1950. doi: 10.18502/ijph.v53i9.16449. Iran J Public Health. 2024. PMID: 39429662 Free PMC article. Review.
Cited by
-
Multiple machine learning-based integrations of multi-omics data to identify molecular subtypes and construct a prognostic model for HNSCC.Hereditas. 2025 Feb 6;162(1):17. doi: 10.1186/s41065-025-00380-0. Hereditas. 2025. PMID: 39910672 Free PMC article.
-
Identification of S1PR4 as an immune modulator for favorable prognosis in HNSCC through machine learning.iScience. 2023 Aug 19;26(9):107693. doi: 10.1016/j.isci.2023.107693. eCollection 2023 Sep 15. iScience. 2023. PMID: 37680482 Free PMC article.
-
Prognostic value of FLOT1-related gene signature in head and neck squamous cell carcinoma: insights into radioresistance mechanisms and clinical outcomes.Cell Death Discov. 2025 May 7;11(1):224. doi: 10.1038/s41420-025-02500-1. Cell Death Discov. 2025. PMID: 40335491 Free PMC article.
-
A deep learning method for classification of HNSCC and HPV patients using single-cell transcriptomics.Front Mol Biosci. 2024 May 30;11:1395721. doi: 10.3389/fmolb.2024.1395721. eCollection 2024. Front Mol Biosci. 2024. PMID: 38872916 Free PMC article.
-
GTSE1 promotes nasopharyngeal carcinoma proliferation and angiogenesis by upregulating STMN1.Cell Div. 2024 May 2;19(1):16. doi: 10.1186/s13008-024-00119-9. Cell Div. 2024. PMID: 38698443 Free PMC article.
References
-
- Bergheim J., Semaan A., Gevensleben H., Groening S., Knoblich A., Dietrich J., et al. (2018). Potential of quantitative SEPT9 and SHOX2 methylation in plasmatic circulating cell-free DNA as auxiliary staging parameter in colorectal cancer: A prospective observational cohort study. Br. J. Cancer 118 (9), 1217–1228. 10.1038/s41416-018-0035-8 - DOI - PMC - PubMed
LinkOut - more resources
Full Text Sources
Research Materials