

doi: 10.1016/j.adro.2022.101039.
eCollection 2022 Nov-Dec.
Why Do Both Mean Dose and V ≥x Often Predict Normal Tissue Outcomes?
Affiliations
- PMID: 36092989
- PMCID: PMC9450075
- DOI: 10.1016/j.adro.2022.101039
Item in Clipboard
Why Do Both Mean Dose and V ≥x Often Predict Normal Tissue Outcomes?
Adv Radiat Oncol.
.
No abstract available
Figures
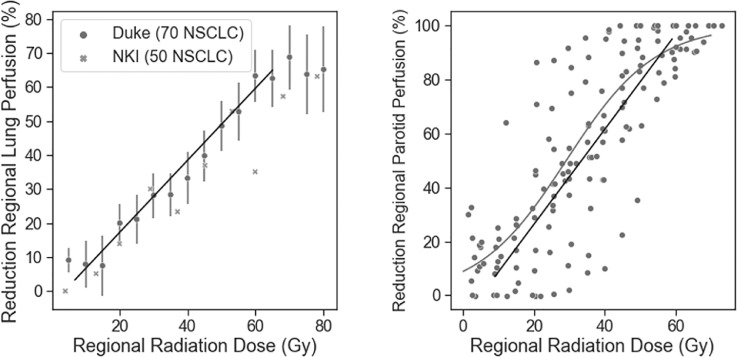
Dose response curves for regional function. Left: Reductions in regional lung perfusion; data from Duke and Netherlands Cancer Institute (NKI) (based on 70 and 50 patients, respectively, with non-small cell lung cancer). Each data point is the weighted average from multiple regions from multiple patients. Right: Reductions in voxel-specific parotid function estimated by 11C-methionine clearance via positron emission tomography. For both images, the solid line was added to illustrate that the data resemble a linear function. The curved line in the image on the right is from the publication by Buus et al. Adapted with permission from Fried et al and Buus et al.
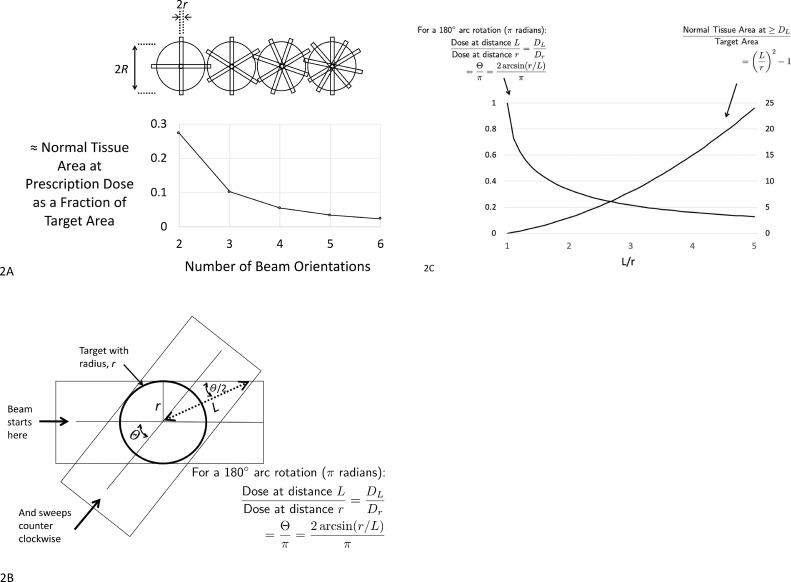
The idealized 2-dimensional situation of a small circular tumor in a larger circular organ at risk is considered, ignoring effects related to beam divergence and beam attenuation. A, As the number of treatment beam orientations increases, the area of normal tissue receiving a low dose increases, and the absolute area depends on the size of the normal organ (eg, R). As the number of treatment beam orientations increases, the area of normal tissue receiving the full prescription dose decreases approximately as shown (eg, assuming full dose delivered to the area of the regular polygon formed by the intersection of multiple beams surrounding a circular target). B, For an arc rotation, the dose to a point at distance L from the target center (DL) / dose to the target dose (Dr) = Θ / π. Because sin (Θ/2) = r/L; Θ = 2 arcsin (DL/Dr), and DL/Dr = 2/π × arcsin (r/L). C, For an arc rotation, the isodose lines are circular with the relative doses at variable values of L, and the area receiving doses ≥DL is computed as shown.
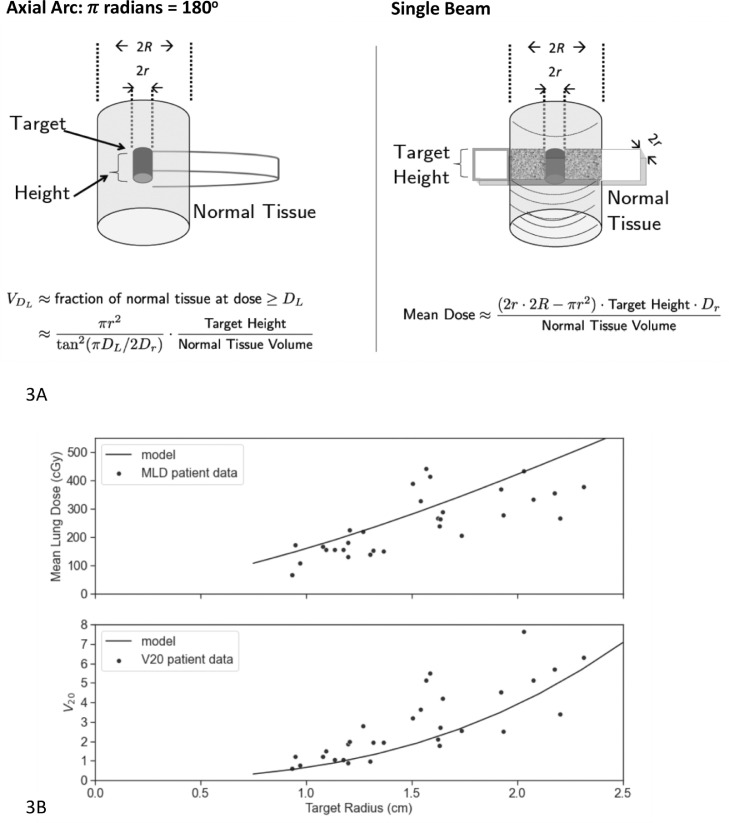
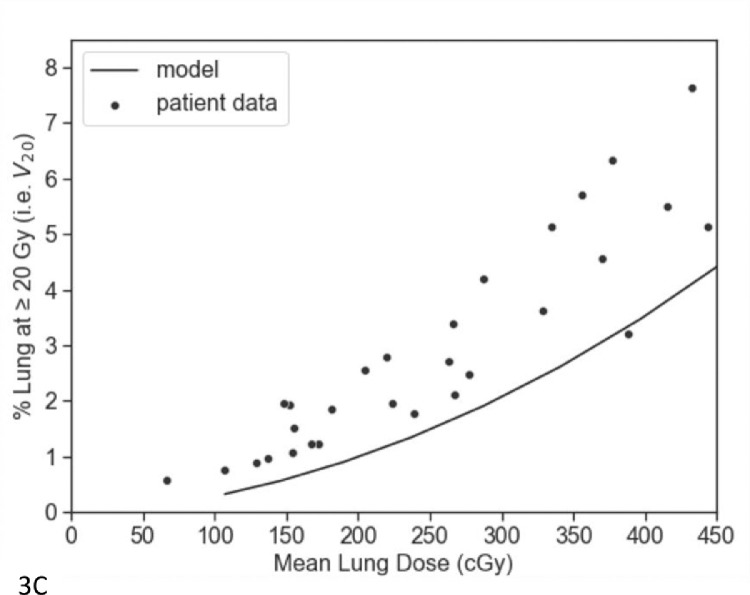
A, On the left, an idealized 3-dimensional (3D) representation of a cylindrical target within a cylindrical normal tissue being treated with an axial arc. The percentage of normal-tissue volume at dose ≥DL can be computed as shown (essentially rearranging the equations in the prior figures; derivation in Appendix 2). On the right, the mean dose to the normal organ can be estimated as shown (for the setting of a single-treatment beam orientation). The mean dose is relatively stable irrespective of the number of beam orientations, as suggested by the cartoon on the top of Figure 2 A and formally demonstrated by others., , B, C, The solid lines are from the idealized 3D model-based calculations of the predicted mean lung dose and V20 for targets with variable radii from 0.75 to 2.5 cm. These are highly correlated with the clinical data from the center of 1 of the authors (dots in B and C). The fit between the idealized model and the clinical data are clearly imperfect. Nevertheless, it is interesting that a simple model can provide reasonable estimates of clinical data. Further details are provided and discussed in Appendix E2.
A, On the left, an idealized 3-dimensional (3D) representation of a cylindrical target within a cylindrical normal tissue being treated with an axial arc. The percentage of normal-tissue volume at dose ≥DL can be computed as shown (essentially rearranging the equations in the prior figures; derivation in Appendix 2). On the right, the mean dose to the normal organ can be estimated as shown (for the setting of a single-treatment beam orientation). The mean dose is relatively stable irrespective of the number of beam orientations, as suggested by the cartoon on the top of Figure 2 A and formally demonstrated by others., , B, C, The solid lines are from the idealized 3D model-based calculations of the predicted mean lung dose and V20 for targets with variable radii from 0.75 to 2.5 cm. These are highly correlated with the clinical data from the center of 1 of the authors (dots in B and C). The fit between the idealized model and the clinical data are clearly imperfect. Nevertheless, it is interesting that a simple model can provide reasonable estimates of clinical data. Further details are provided and discussed in Appendix E2.
References
-
- Bates JE, Keshavarz H, Rancati T, et al. Cardiac disease in childhood cancer survivors treated with radiotherapy: A systematic review. Int J Radiat Oncol Biol Phys. Submitted. - PubMed
-
- Milgrom SA, van Luijk P, Pino R, et al. Salivary and dental complications in childhood cancer survivors treated with radiation therapy to the head and neck: A pediatric normal tissue effects in the clinic (PENTEC) comprehensive review. In press. - PubMed
Grants and funding
LinkOut - more resources
Full Text Sources
