. 2022 Aug 18;25(9):104980.
doi: 10.1016/j.isci.2022.104980. eCollection 2022 Sep 16.

Multiplexed protein profiling reveals spatial subcellular signaling networks

Affiliations

Multiplexed protein profiling reveals spatial subcellular signaling networks

Shuangyi Cai et al. iScience. .

Abstract

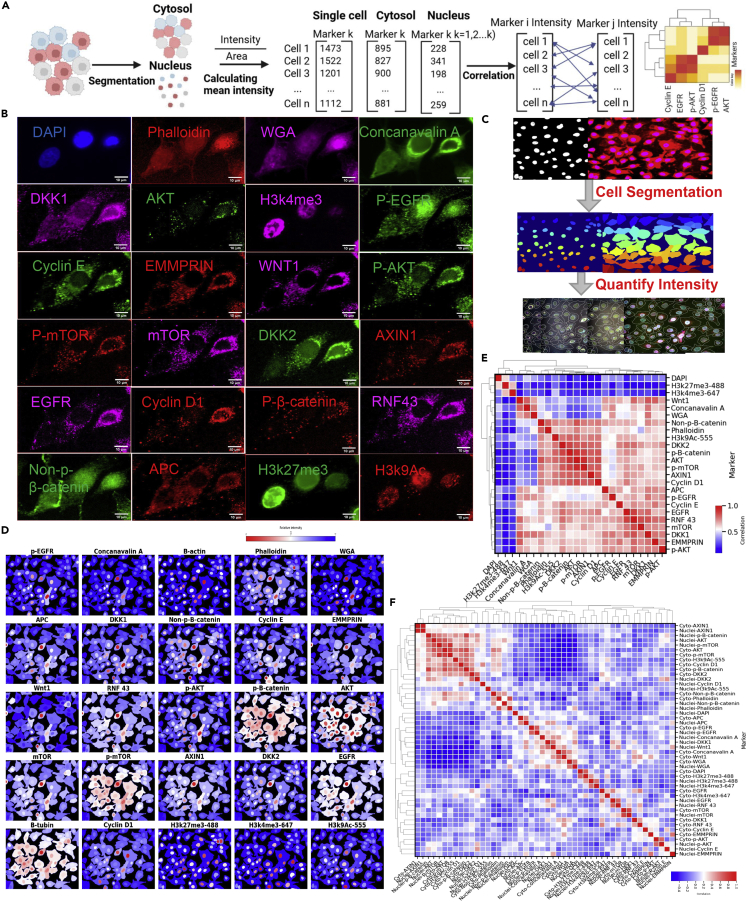
Protein-protein interaction networks are altered in multi-gene dysregulations in many disorders. Image-based protein multiplexing sheds light on signaling pathways to dissect cell-to-cell heterogeneity, previously masked by the bulk assays. Herein, we present a rapid multiplexed immunofluorescence (RapMIF) method measuring up to 25-plex spatial protein maps from cultures and tissues at subcellular resolution, providing combinatorial 272 pairwise and 1,360 tri-protein signaling states across 33 multiplexed pixel-level clusters. The RapMIF pipeline automated staining, bleaching, and imaging of the biospecimens in a single platform. RapMIF showed that WNT/β-catenin signaling upregulated upon the inhibition of the AKT/mTOR pathway. Subcellular protein images demonstrated translocation patterns, spatial receptor discontinuity, and subcellular signaling clusters in single cells. Signaling networks exhibited spatial redistribution of signaling proteins in drug-responsive cultures. Machine learning analysis predicted the phosphorylated β-catenin expression from interconnected signaling protein images. RapMIF is an ideal signaling discovery approach for precision therapy design.

Keywords: Biological sciences; Biological sciences research methodologies; Biology experimental methods; Biotechnology.


Conflict of interest statement

The authors declare no competing interests.

Figures

None
Graphical abstract
Figure 1
Figure 1
Rapid multiplexed immunofluorescence (RapMIF) for subcellular spatial protein analysis (A) A schematic setup of a Rapid, automated, and multiplexed imaging system was presented. The samples were stained with multiple cycles of IF using an autostainer. Created with BioRender.com. (B) The left panel indicates the activated Wnt and AKT signaling pathways; the markers highlighted in red were included in our panel. The right diagram demonstrates the predicted PPIs among these proteins. Created with BioRender.com. (C) Predicted expression of signaling markers in PC9 cells was provided from the multiplexed protein data. Created with BioRender.com. (D) Schematic of the tissue samples stained with pan-cytokeratin used for tumor and stroma analysis of spatial signaling networks. Created with BioRender.com. (E) An illustration of the data processing and analysis pipeline was shown. Multiplexed images provided the nuclear and cytosolic masks in A549 cells, correlation plot, protein prediction, the p-EGFR spatial intensity plot, and the pixel clustering maps of an individual PC9 cell. Created with BioRender.com.
Figure 2
Figure 2
Expression profiles and correlation analysis of multiplexed signaling proteins in A549 cells (A) The correlation analysis pipeline of protein intensity at the single-cell level. Created with BioRender.com. (B) Raw staining images in A549 cells from 23 protein markers and DAPI from 11 cycles were shown. (C) A workflow of data analysis was presented. The raw images were segmented and masked using WGA, concanavalin A, WNT1, APC, and p-EGFR. The signaling intensity was quantified based on the cytoplasmic and nuclear masks. (D) Normalized mean intensity per cell of 25 markers for one ROI. Sixty-three regions of interest and a total of 3,457 numbers of A549 cells were analyzed. The normalized total intensity was shown in Figure S10. (E) Pairwise marker correlation based on single-cell mean intensity in A549 cells was evaluated using Pearson Correlation and average linkage method on Euclidean distance. The correlation of total intensity per marker per cell was shown in Figure S11, and the correlation of total intensity was shown in Figure S12. The pairwise Pearson correlations were corrected by the Holm-Šídák method, yielding significance with a p value of p<=0.0001 (∗∗∗∗). (F) Pairwise marker correlation based on single-cell mean intensity in the cytoplasm and nucleus-dependent manner was evaluated using Pearson Correlation using average linkage method on Euclidean distance from the same cell as (D). The pairwise Pearson correlations were corrected by the Holm-Šídák method, yielding significance with a p value of p<=0.0001 (∗∗∗∗).
Figure 3
Figure 3
Spatial signaling network analysis in single pixels and prediction of phosphoproteins in A549 cells (A) Pixel clustering analysis pipeline was demonstrated. Created with BioRender.com. (B) Spatial signaling maps of 33 clusters at the single-pixel level were provided. The UMAP representation of the distribution of these clusters in A549 cells was shown. The legend showed the cluster name in a frequency-descending order for each cell. (C) A heatmap of 33 clusters on a Z score scale was shown. Each cluster represented one distinct expression profile of 21 protein markers in A549 cells. Data are represented as mean expression per cluster. (D) Pixel-level clustering of signaling proteins in one ROI in A549 cells was demonstrated. The highly expressed signaling proteins of different clusters were indicated in each cancer cell. (E) The importance of 20 protein markers in A549 cells was evaluated based on the random forest algorithm model mean decrease in impurity (MDI). The MDI was defined as the total decrease in node impurity (weighted by the probability of reaching that node averaged over all trees of the ensemble in the random forest algorithm.) (F) The expression level of p-β-catenin in A549 cells was predicted based on 20 features (R = 0.75, p value <0.001). (G) Comparison between the intensity level of the raw p- β-catenin and the predicted intensity in one ROI was obtained based on random forest analysis in A549 cells. (H) The quantification of cyclin D1 expression across DAPI expression level per cell in A549 cells. Most of the cells were harvested in the G1 phase. The right images show the comparisons of the cyclin D1 expression level in three cells in three different phases. Cell number 25 has a relatively higher cyclin D1 intensity than cell 23 and cell 28.
Figure 4
Figure 4
The effect of osimertinib on signaling expression profiles and correlation analysis in PC9 cells (A) Raw staining images in PC9 cells from 23 protein markers and DAPI from 12 cycles were presented. The cells were incubated in cell media for 48 h and seeded on coverslips for multiplexing IF. n = 531 number of cells were utilized. (B) Raw staining images in PC9 cells from 23 protein markers and DAPI from 12 cycles were shown. The cells were treated with 40nM osimertinib for 48 h and seeded on coverslips for multiplexing IF. n = 451 number of cells were used. (C) The correlation of the single-cell mean intensity of 23 markers for control PC9 was evaluated using Pearson Correlation using the average linkage method based on Euclidean distance. The pairwise Pearson correlations were corrected by the Holm-Šídák method, yielding significance with a p value of p<=0.0001 (∗∗∗∗). (D) The correlation of the single-cell mean intensity of 23 markers for PC9 cells treated with 40nM osimertinib for 48 h was evaluated using Pearson Correlation based on the average linkage method implemented on Euclidean distance. The pairwise Pearson correlations were corrected by the Holm-Šídák method, yielding significance with a p value of p<=0.0001 (∗∗∗∗). (E) The p-EGFR (Tyr1086) intensity in PC9 cells across four-drug concentrations, 0, 20, 40, and 60 nM was analyzed and normalized to β-tubulin. The cells were treated with drug or cell media for 48 h and seeded on coverslips. The cells were stained with p-EGFR, and β-tubulin overnight at 4°C, followed by secondary antibody staining at RT 1 h, 15 min DAPI staining. Asterisk indicates the statistical significance for pairwise comparison; p-value calculated using Wilcoxon rank-sum test with Bonferroni correction (ns: 0.05 < p, ∗: 0.01 < p ≤ 0.05, ∗∗: 0.001 < p ≤ 0.01 ∗∗∗: 0.0001 < p ≤ 0.001, ∗∗∗∗: p<=0.0001). Boxplot showing the distribution of the data with minimum, first quartile (Q1), median, third quartile (Q3), and maximum. (F) The comparison of expression profiles of 24 markers between control and 40nM osimertinib samples was demonstrated. Boxplot showing the distribution of the data with minimum, first quartile (Q1), median, third quartile (Q3), and maximum. (G) The p-AKT(S473) intensity comparison between PC9 control and PC9 treated with 40-nM osimertinib multiplexing samples was provided. Asterisk indicates the statistical significance for pairwise comparison; p-value calculated using Wilcoxon rank-sum test with Bonferroni correction (ns: 0.05 < p, ∗: 0.01 < p ≤ 0.05, ∗∗: 0.001 < p ≤ 0.01 ∗∗∗: 0.0001 < p ≤ 0.001, ∗∗∗∗: p<=0.0001).
Figure 5
Figure 5
The effect of osimertinib in spatial subcellular distribution and network in PC9 cells (A) Pseudo-colored cells by pixel clustering of 20 signaling protein markers in PC9 cells without osimertinib treatment. The legend indicates the cluster name in a frequency-descending order for each cell. (B) Colored cells by pixel clustering of 20 signaling protein markers in PC9 cells with 48-h 40-nM osimertinib treatment. The legend provides the cluster name in a frequency-descending order for each cell. (C) Heatmap of 20 clusters on a Z score scale was shown. Each cluster represented one distinct expression profile of 20 protein markers in PCI cells. Data are represented as mean expression per cluster. (D) Analysis pipeline for spatial networks was outlined. Created with BioRender.com. (E) Spatial signaling networks of 19 clusters in control and 40nM osimertinib-treated samples were provided. Each node was labeled with one of the most expressed signaling markers (excluding the epigenetic markers) in that cluster of pixels shown in Figure S25D. The color of the node matched with the cluster color shown in (C), the color of the line represented the probability of neighboring with another cluster, and the size of the node provided the pixel distribution across all clusters.
Figure 6
Figure 6
Expression and spatial signaling analysis on tissue microarray from diverse lung cancers (A) Multiplexed protein images of lung tissue samples at normal, malignant stages IB, IIA, and IIIA were presented. The tissue was masked based on pan-cytokeratin-positive staining. (B) The normalized total intensity of each marker per cell was provided in pan-cytokeratin-negative (false) and -positive (true) regions. Asterisk indicates the statistical significance for pairwise comparison; p-value calculated using Wilcoxon rank-sum test (ns: 0.05 < p, ∗: 0.01 < p ≤ 0.05, ∗∗: 0.001 < p ≤ 0.01 ∗∗∗: 0.0001 < p ≤ 0.001, ∗∗∗∗: p<=0.0001). Boxplot showing the distribution of the data with minimum, first quartile (Q1), median, third quartile (Q3), and maximum. (C) The comparison of signaling expression profiles of 24 markers was provided. The tissue cores were classified by stages and pan-cytokeratin expression. Classification of signaling maps was demonstrated for 21 patients and 55 tissue cores using the average linkage method based on Euclidean distance to cluster cores and markers along the x and y axis. Data are represented as mean expression per core. (D) Heatmap of 19 clusters on a Z score scale was shown. Each cluster represented one distinct expression profile of 17 protein markers in lung microarray, excluding segmentation and epigenetic markers. Data are represented as mean expression per cluster. (E) Multiplexed signaling protein images from tissue cores were analyzed by single-cell level clustering of 17 protein markers in four stages of tumor. The expression profile was clustered in pan-cytokeratin-positive regions. Each stage contained three images from the same patient.

Similar articles

Cited by

References

    1. Alam M.S. Proximity ligation assay (PLA) Curr. Protoc. Immunol. 2018;123:e58. doi: 10.1002/cpim.58. - DOI - PMC - PubMed
    1. Baharlou H., Canete N.P., Cunningham A.L., Harman A.N., Patrick E. Mass cytometry imaging for the study of human diseases—applications and data analysis strategies. Front. Immunol. 2019;10:2657. doi: 10.3389/fimmu.2019.02657. - DOI - PMC - PubMed
    1. Bai M., Li W., Yu N., Zhang H., Long F., Zeng A. The crosstalk between β-catenin signaling and type I, type II and type III interferons in lung cancer cells. Am. J. Transl. Res. 2017;9:2788–2797. - PMC - PubMed
    1. Barlési F., Giaccone G., Gallegos-Ruiz M.I., Loundou A., Span S.W., Lefesvre P., Kruyt F.A.E., Rodriguez J.A. Global histone modifications predict prognosis of resected non–small-cell lung cancer. J. Clin. Oncol. 2007;25:4358–4364. doi: 10.1200/JCO.2007.11.2599. - DOI - PubMed
    1. Brand T.M., Iida M., Li C., Wheeler D.L. The nuclear epidermal growth factor receptor signaling network and its role in cancer. Discov. Med. 2011;12:419–432. - PMC - PubMed

LinkOut - more resources