. 2022 Aug 20;25(9):104983.
doi: 10.1016/j.isci.2022.104983. eCollection 2022 Sep 16.

Heme oxygenase-1 mitigates liver injury and fibrosis via modulation of LNX1/Notch1 pathway in myeloid cells

Affiliations

Heme oxygenase-1 mitigates liver injury and fibrosis via modulation of LNX1/Notch1 pathway in myeloid cells

Giacomo Canesin et al. iScience. .

Abstract

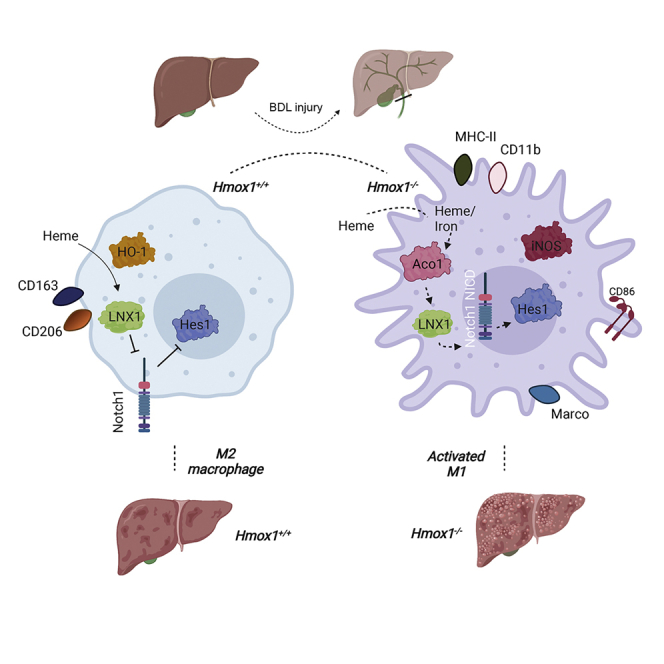
Activation of resident macrophages (Mϕ) and hepatic stellate cells is a key event in chronic liver injury. Mice with heme oxygenase-1 (HO-1; Hmox1)-deficient Mϕ (LysM-Cre:Hmox1 flfl ) exhibit increased inflammation, periportal ductular reaction, and liver fibrosis following bile duct ligation (BDL)-induced liver injury and increased pericellular fibrosis in NASH model. RiboTag-based RNA-sequencing profiling of hepatic HO-1-deficient Mϕ revealed dysregulation of multiple genes involved in lipid and amino acid metabolism, regulation of oxidative stress, and extracellular matrix turnover. Among these genes, ligand of numb-protein X1 (LNX1) expression is strongly suppressed in HO-1-deficient Mϕ. Importantly, HO-1 and LNX1 were expressed by hepatic Mϕ in human biliary and nonbiliary end-stage cirrhosis. We found that Notch1 expression, a downstream target of LNX1, was increased in LysM-Cre:Hmox1 flfl mice. In HO-1-deficient Mϕ treated with heme, transient overexpression of LNX1 drives M2-like Mϕ polarization. In summary, we identified LNX1/Notch1 pathway as a downstream target of HO-1 in liver fibrosis.

Keywords: Biological sciences; Cell biology; Human physiology; Stem cells research.


Conflict of interest statement

The authors declare no competing interests.

Figures

None
Graphical abstract
Figure 1
Figure 1
The role of myeloid-cell-expressed HO-1 in the BDL murine model of liver fibrosis (A) Immunohistochemical (IHC) staining with antibodies against HO-1 in the liver samples from control and BDL-treated mice showing staining in sinusoidal macrophages. Scale bar: 100 μm. (B) Western blot analysis of HO-1 and E-cadherin expression in liver lysates from mice untreated (naive) or subjected to BDL surgery (17 days post-surgery, BDL). (C) Percentage of liver weights change per body weights (BW) of Hmox1flfl (WT) or LysM-Cre:Hmox1flfl (KO) mice, which were untreated or subjected to BDL surgery, 11 or 17 days post-surgery. ANOVA, p < 0.0001, Student’s t test: ∗∗∗p < 0.001, ∗p < 0.05. Data are represented as mean ± SEM n = 5–18 female and male mice per group. (D) Hydroxyproline levels in the livers exposed to BDL surgery as described in (A) and harvested 17 days after BDL. ANOVA, p = 0.0376, Student’s t test: ∗p < 0.05, ∗∗p < 0.01. Data are represented as mean ± SEM. (E–H) Lobular necrosis (H &E, E) and fibrosis (Sirius red, G) in the livers from mice treated as in (A). Representative sections are shown from BDL-treated mice in (E) and (G) (100x magnification) and quantification of the data is presented in (F) and (H). Data are represented as mean ± SEM. ANOVA, p < 0.0001, Tukey’s multiple comparison test: ∗∗p < 0.01, ∗∗∗p < 0.001. Scale bar: 200 μm.
Figure 2
Figure 2
Deletion of HO-1 in macrophages leads to enhanced ductal reaction (A–C) RT-PCR using the total liver mRNA and primers for COL1 (A), TGFβ (B), and ACTA2 (C). Data are represented as mean ± SEM. ANOVA, p < 0.0001, Tukey’s multiple comparison test: ∗p < 0.05, ∗∗p < 0.01, ∗∗∗p < 0.001. (D–G) IHC staining with antibodies against E-cadherin (D) or CK-19 (F) in the liver samples from control and BDL-treated mice. Magnification of 200× (upper panels) or 400x (lower panels). Quantification of the data is shown in (E) and (G). Data are represented as mean ± SEM. ANOVA, p < 0.0001, Tukey’s multiple comparison test: ∗∗∗p < 0.001. Scale bar: 50 μm.
Figure 3
Figure 3
Deletion of HO-1 in myeloid cells impacts Mφ phenotype as assessed by RiboTag approach (A and B) Liver lysates from LysM-Cre:RiboTag mice were subjected to immunoprecipitation (IP) with anti-HA antibody. A scheme of the technology is shown in (A). Myeloid markers were assessed by RT-PCR and are shown in (B). Data are represented as mean ± SEM. (C–J) LysM-Cre:RiboTag or LysMCre:Hmox1flfl: RiboTag mice were subjected to BDL surgery as described in Figure 1. RT-PCR was performed on the RNA from the IP with anti-HA antibody. Data are represented as mean ± SEM. ANOVA, p < 0.0001, Tukey’s multiple comparison test: ∗∗∗p < 0.001, ∗∗p < 0.01. n = 5–18 female and male mice per group.
Figure 4
Figure 4
LNX1 is the HO-1 target gene in myeloid cells (A) Gene clustering based on the RNA-seq on the RNA obtained from the IP with anti-HA antibody from the liver lysates of LysM-Cre:RiboTag (WT) and LysMCre:Hmox1flfl:RiboTag (HO-1KO−M) subjected to BDL surgery as in Figure 1. n = 2 mice per group. (B–G) Confirmatory RT-PCR using the RNA isolated as in (A), assessing the top target genes as identified by RNA-seq (17 days after BDL). Data are represented as mean ± SEM. ANOVA, p < 0.0001, Dunn’s multiple comparison test: ∗∗∗p < 0.001, ∗∗p < 0.01, ∗p < 0.05. n = 5–18 female and male mice per group. (H–J) Immunohistochemical staining of LNX1 in the liver samples from control and BDL-treated mice. Quantification of the data is shown in (I) and (J). Data are represented as mean ± SD. ANOVA, p < 0.01, Student’s t test: ∗∗p < 0.01, ∗p < 0.05. Scale bar: 100 μm. (L–N) Immunohistochemical staining of Aco1/Irp1 in the liver samples from control and BDL-treated mice. Quantification of the data is shown in (I) and (J). Data are represented as mean ± SD. ANOVA, p < 0.01, Student’s t test: ∗p < 0.05. Scale bar: 100 μm.
Figure 5
Figure 5
Detection of HO-1+ and LNX1+ cells in the human samples with increasing fibrosis stage and assessment of the role of HO-1 in myeloid cells in fibrosis progression in murine NASH model (A–D) IHC staining with antibodies against LNX1 or HO-1 in (A) human liver biopsies from n = 5 patients with various stages of NAFLD/NASH with the clinical characteristic as described in STAR Methods. (B–D) Human liver explants obtained from patients undergoing orthotopic liver transplantation due to end-stage liver disease of various etiologies (n = 3 PBC, n = 5 Alc, n = 5 Crypt) (Peng et al., 2016). Representative staining in myeloid cells/macrophages is shown in (A) and (B). Scale bar: 100 μm (A) and 50 μm (B). Quantification of the HO-1+ and LNX1+ cells are shown in (C) and (D). Data are represented as mean ± SEM. ANOVA, not significant. (E–G) Hmox1flfl (Hmox1flfl) or LysM-Cre:Hmox1flfl (Cre:Hmox1flfl) mice were fed with methionine- and choline-deficient (MCD) diet for 3 weeks. Livers were evaluated for fibrosis and fatty scores based on the Sirius red staining and H&E. Data are represented as mean ± SEM. Student’s t test: ∗p < 0.05. n = 10 mice/group. Scale bar: 100 μm.
Figure 6
Figure 6
The role of LNX1 in Mφ (A–C) Bone-marrow-derived Mφ (BMDM) were isolated from Hmox1flfl or LysM-Cre:Hmox1flfl and treated with heme (1–50 μM) for 24 h. Protein analyses were performed with antibodies against HO-1, LNX1, and Aco1/IRP1. Quantification of LNX1 expression is shown in (C). Data are represented as mean ± SEM. ANOVA, p = 0.144, Student’s t test: ∗∗p < 0.01. (D–G) LNX1 was overexpressed in RAW264.7 Mφ by transient transfection. Western blot with antibody against LNX1 is shown in (D). RT-PCR analyses with indicated primers in the RAW264.7 Mφ with transient overexpression of LNX1 and treated with heme (50 μM) for 6 h are shown in (E–G). Data are represented as mean ± SEM. ANOVA, p < 0.01, Tukey’s multiple comparison test: ∗p < 0.05, ∗∗p < 0.01.
Figure 7
Figure 7
A crosstalk of HO-1 and Notch1 signaling in Mφ (A and B) Immunostaining with antibody against Notch1 total was performed in the livers isolated from Hmox1flfl or LysM-Cre:Hmox1flfl (Cre:Hmox1flfl) mice after BDL surgery. Scale bar: 100 μm (insets: 400x magnification). The quantification of a number of Notch1+ cells is shown in (B). Data are represented as mean ± SEM. ANOVA, p < 0.001, Tukey’s multiple comparison test: ∗p < 0.05, ∗∗∗p < 0.001. (C–E) LysM-Cre:RiboTag (Hmox1flfl) or LysMCre:Hmox1flfl: RiboTag (Cre:Hmox1flfl) mice were subjected to BDL surgery as in Figure 2. RT-PCR was performed using RNA isolated from the immunoprecipitates with the anti-HA antibody. Data are represented as mean ± SEM. ANOVA, p < 0.0001, Tukey’s multiple comparison test: ∗∗∗p < 0.001, ∗∗p < 0.01. n = 5–18 female and male mice per group. (F) Scheme representing the interaction of LNX1 in HO-1 and regulation of Mφ phenotype during liver injury.

References

    1. Adams J.M., Jafar-Nejad H. The roles of Notch signaling in liver development and disease. Biomolecules. 2019;9 doi: 10.3390/biom9100608. - DOI - PMC - PubMed
    1. An P., Wei L.L., Zhao S., Sverdlov D.Y., Vaid K.A., Miyamoto M., Kuramitsu K., Lai M., Popov Y.V. Hepatocyte mitochondria-derived danger signals directly activate hepatic stellate cells and drive progression of liver fibrosis. Nat. Commun. 2020;11:2362. doi: 10.1038/s41467-020-16092-0. - DOI - PMC - PubMed
    1. Asimakopoulou A., Weiskirchen S., Weiskirchen R. Lipocalin 2 (LCN2) expression in hepatic malfunction and therapy. Front. Physiol. 2016;7:430. doi: 10.3389/fphys.2016.00430. - DOI - PMC - PubMed
    1. Asrani S.K., Devarbhavi H., Eaton J., Kamath P.S. Burden of liver diseases in the world. J. Hepatol. 2019;70:151–171. doi: 10.1016/j.jhep.2018.09.014. - DOI - PubMed
    1. Baisiwala S., Hall R.R., 3rd, Saathoff M.R., M Shireman J., Park C., Budhiraja S., Goel C., Warnke L., Hardiman C., Wang J.Y., et al. LNX1 modulates Notch1 signaling to promote expansion of the glioma stem cell population during temozolomide therapy in glioblastoma. Cancers. 2020;12:E3505. doi: 10.3390/cancers12123505. - DOI - PMC - PubMed