

Investigating the impact of peer supplemental instruction on underprepared and historically underserved students in introductory STEM courses
- PMID: 36093288
- PMCID: PMC9443649
- DOI: 10.1186/s40594-022-00372-w
Investigating the impact of peer supplemental instruction on underprepared and historically underserved students in introductory STEM courses
Abstract
Background: Supplemental instruction (SI) is a well-established mode of direct academic support, used in a wide variety of courses. Some reports have indicated that SI and similar peer-led academic support models particularly benefit students identifying with historically underserved racial/ethnic groups in STEM. However, these studies have not explicitly examined the role of prior academic experiences, an important consideration in college success. We report on the impact of a modified SI model, Peer Supplemental Instruction (PSI), on student success in introductory STEM courses at a diverse access institution. This study focuses on PSI's impact on the academic performance of students identifying with historically underserved racial/ethnic groups, while also considering the effects of prior academic experiences.
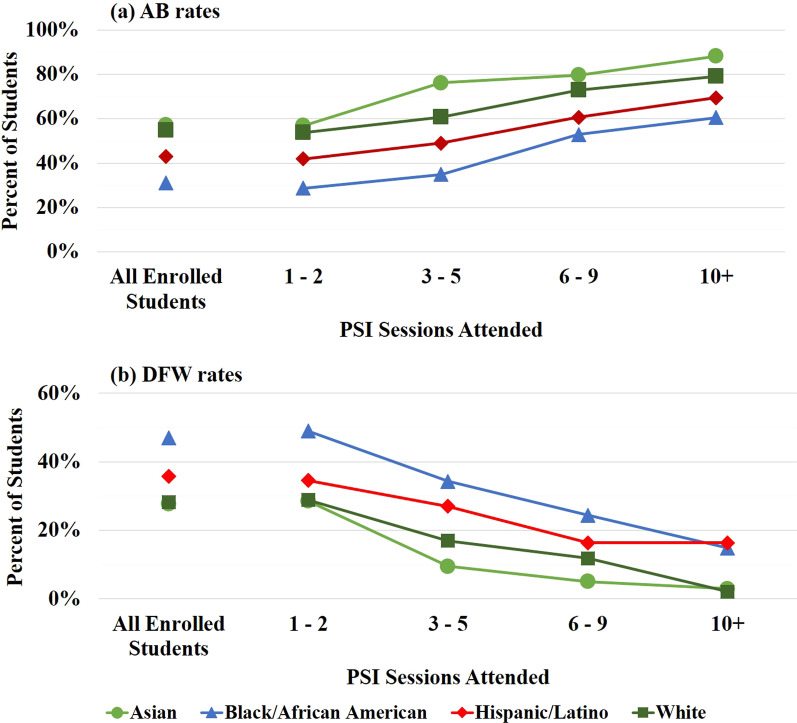
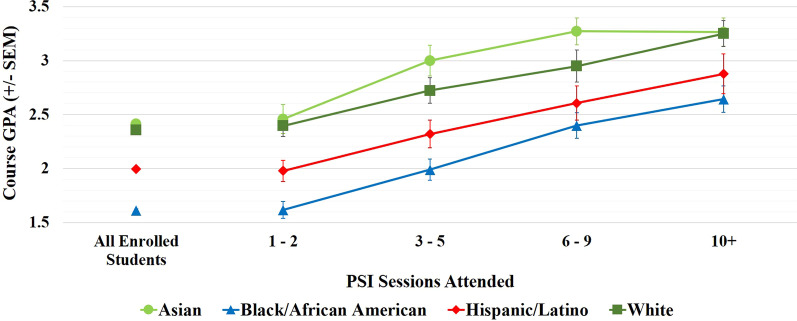
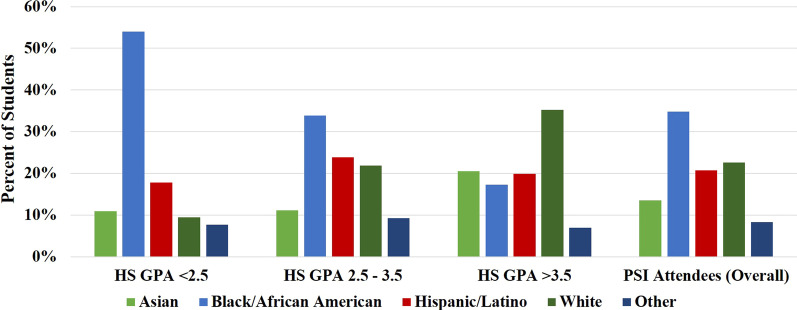
Results: Data were aggregated for nine courses over five semesters to produce a robust data set (n = 1789). PSI attendees were representative of the overall student population in terms of previous academic experiences/performance (as determined by high school GPA) and self-identified racial/ethnic demographics. Frequent PSI attendance was correlated with a significant increase in AB rates (average increase of 29.0 percentage points) and reduction in DFW rates (average decrease of 26.1 percentage points) when comparing students who attended 10 + vs. 1-2 PSI sessions. Overall, students identifying as Black/African American received the largest benefit from PSI. These students experienced a significant increase in their final course GPA when attending as few as 3-5 PSI sessions, and exhibited the largest increase in AB rates (from 28.7 to 60.5%) and decrease in DFW rates (from 47.1 to 14.8%) when comparing students who attended 10 + vs. 1-2 sessions. However, students with similar HS GPAs experienced similar benefits from PSI, regardless of self-identified race/ethnicity.
Conclusions: The data presented here suggest that PSI particularly benefitted underprepared students in their introductory STEM courses. Since students identifying with historically underserved racial/ethnic groups have traditionally had inequitable K-12 educational experiences, they enter college less prepared on average, and thus particularly benefit from PSI. PSI, in conjunction with additional strategies, may be a useful tool to help rectify the results of systemic educational inequities for students identifying with historically underserved racial/ethnic groups.
Keywords: Academic preparedness; Diversity; Equity; Gateway courses; Historically underserved; STEM education; Student success; Supplemental instruction.
© The Author(s) 2022.
Conflict of interest statement
Competing interestsThe authors declare that they have no competing interests.
Figures


References
-
- Achat-Mendes C, Anfuso C, Johnson C, Shepler B, Hurst-Kennedy J, Pinzon K, et al. Learning, leaders, and STEM skills: Adaptation of the supplemental instruction model to improve STEM education and build transferable skills in undergraduate courses and beyond. Journal of STEM Education: Innovations and Research. 2020;20(2):5–14.
-
- Adelman, C. (1999). Answers in the Tool Box. Academic intensity, attendance patterns, and bachelor's degree attainment. National Institute on Postsecondary Education, Libraries, and Lifelong Learning. Jessup, MD: ED Pubs.
-
- Allensworth EM, Clark K. High school GPAs and ACT scores as predictors of college completion: Examining assumptions about consistency across high schools. Educational Researcher. 2020;49(3):198–211. doi: 10.3102/0013189X20902110. - DOI
-
- Awong-Taylor J, D'Costa A, Giles G, Leader T, Pursell D, Runck C, Mundie T. Undergraduate research for all: Addressing the elephant in the room. Council on Undergraduate Research Quarterly. 2016;37(1):11–19. doi: 10.18833/curq/37/1/4. - DOI
LinkOut - more resources
Full Text Sources