[Preprint]. 2022 Sep 2:2022.08.31.506117.
doi: 10.1101/2022.08.31.506117.

Microfluidic immuno-serology assay revealed a limited diversity of protection against COVID-19 in patients with altered immunity

Affiliations

Microfluidic immuno-serology assay revealed a limited diversity of protection against COVID-19 in patients with altered immunity

Dongjoo Kim et al. bioRxiv. .

Abstract

The immune response to SARS-CoV-2 for patients with altered immunity such as hematologic malignancies and autoimmune disease may differ substantially from that in general population. These patients remain at high risk despite wide-spread adoption of vaccination. It is critical to examine the differences at the systems level between the general population and the patients with altered immunity in terms of immunologic and serological responses to COVID-19 infection and vaccination. Here, we developed a novel microfluidic chip for high-plex immuno-serological assay to simultaneously measure up to 50 plasma or serum samples for up to 50 soluble markers including 35 plasma proteins, 11 anti-spike/RBD IgG antibodies spanning all major variants, and controls. Our assay demonstrated the quintuplicate test in a single run with high throughput, low sample volume input, high reproducibility and high accuracy. It was applied to the measurement of 1,012 blood samples including in-depth analysis of sera from 127 patients and 21 healthy donors over multiple time points, either with acute COVID infection or vaccination. The protein association matrix analysis revealed distinct immune mediator protein modules that exhibited a reduced degree of diversity in protein-protein cooperation in patients with hematologic malignancies and patients with autoimmune disorders receiving B cell depletion therapy. Serological analysis identified that COVID infected patients with hematologic malignancies display impaired anti-RBD antibody response despite high level of anti-spike IgG, which could be associated with limited clonotype diversity and functional deficiency in B cells and was further confirmed by single-cell BCR and transcriptome sequencing. These findings underscore the importance to individualize immunization strategy for these high-risk patients and provide an informative tool to monitor their responses at the systems level.


Figures
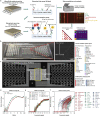
Figure 1.
Figure 1.. High-plex immuno-serology assay design and titration test.
(a) Schematic workflow. The first PDMS “microfluidic patterning chip” with 50 parallel microchannels was placed on the poly-l-lysine coated glass slide (PLL slide), then purified antibodies or SARS-CoV-2 recombinant antigens were flowed into the microchannels. After removing the first PDMS, the second “microfluidic test chip” was placed on the same PLL slide. Then, serum samples were added, and the captured proteins or SARS-Cov-2 binding antibodies were detected via a surface-bound immune-sandwich assay. Finally, scanning fluorescent images were obtained and analyzed. (b) Photographic image of the first PDMS microchip. (c) Integrated device design after overlaying the first and second PDMS. The protein and SARS-CoV-2 serology panels evaluated in this work are listed on the right side. (d) The titration curves of US SARS-CoV-2 serology standard (Frederick National Laboratory). (e) The titration curves of SARS-CoV-2 anti-spike/RBD antibodies. (f) The titration curves of protein panels. Each titration curve was plotted with hyperbola equation in nonlinear regression. The data presented is the mean value of 5 replicates from a single assay. Scatter plots show means ± SEM. PDMS, polydimethylsiloxane; Ab, antibody; BSA, bovine serum albumin; FITC, fluorescein isothiocyanate; APC, allophycocyanin; PE, phycoerythrin; BAU, Binding Antibody Units.
Figure 2.
Figure 2.. Validation of assay performance.
(a) Representative fluorescent image of high-plex immune-serology assay in the measurement of 48 serum samples in a single run. Red and yellow signal represent the plasma protein and SARS-CoV-2 IgG Ab, respectively. Enlarged image shows a fluorescence signal from 5 serum samples. FITC conjugated BSA was introduced to differentiate first column. (b) The evaluation of potential channel cross-talk. Antibodies generated from other species were coated for the indicated proteins, and the remaining 29 are mouse-derived capture antibodies. FITC-conjugated anti-mouse IgG Ab was introduced to the first row. (c) Device-to-device reproducibility evaluation using 5 barcoded array chips prepared at different time points. (d) The Pearson correlations across all the 5 chips. (e) The correlation plot between our high-plex assay and commercialized Quest diagnosis in the measurement of 98 serum samples. (f) The sensitivity and specificity of each evaluated anti-spike/RBD antibody. 101 preliminary blinded samples from NCI-Frederick National Laboratory for Cancer Research were used. (g) The concentration comparisons between anti-spike or anti-RBD antibodies. (h) The sensitivity and specificity of nucleocapsid in the test of 101 preliminary blinded samples. (i) Unsupervised clustering of all the 1012 samples measured using our assay (only for visualization). The concentrations of the 35 proteins and 10 anti-spike/RBD antibodies were used to perform the clustering. Each point represents one measured sample. P values were calculated with two-tailed Mann-Whitney test. (* P < 0.05, ** P < 0.01, *** P < 0.001, **** P < 0.0001). Scatter plots show means ± SEM. Ab, antibody; BSA, bovine serum albumin; FITC, fluorescein isothiocyanate.
Figure 3.
Figure 3.. Vaccination-induced immunological functional protein response in each patient and donor group.
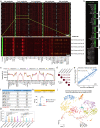
(a-d) Correlation matrices of the 35 proteins evaluated in our high-plex immuno-serology assay panel for Non-Heme cancer patients pre-vaccination (a) and post-vaccination (c); autoimmune patients with B cell depletion therapy pre-vaccination (b) and post-vaccination (d). Only significant correlations (<0.05) are represented as dots. Pearson’s correlation coefficients from comparisons of protein concentrations across all the patients in a specific group are visualized by color intensity. Proteins were ordered by hierarchical clustering. (e-g) Comparisons of the average concentration of each functional protein category between pre- and post-vaccination in healthy donors (e); Non-Heme cancer patients (f); and autoimmune (B cell depleted) patients (g). (h-j) Comparisons of the average concentration of proteins regulating pro-inflammatory pathways (h); effector T cells (i); and endotheliopathy (j) between pre-vaccination and different timepoints post-vaccination. Visit 1, two weeks after the first vaccine dose; Visit 2, 0~3 days before the second vaccine dose; Visit 3, two weeks after the second vaccine dose. P values were calculated with two-tailed Mann-Whitney test. (* P < 0.05, ** P < 0.01, *** P < 0.001, **** P < 0.0001). ns, not significant.
Figure 4.
Figure 4.. SARS-CoV-2 natural infection and vaccination induce different magnitude of pro-inflammatory signature, correlating to the level-of-care for patients.
(a) Unsupervised clustering of 302 patient serum samples based on the concentrations of the 35-protein panel. UMAP is used to visualize the data. (b) UMAP representation split by patient conditions. Samples from COVID-19 infected patients are localized in cluster 2. (c) Differentially expressed proteins that define each cluster. (d) Comparisons of the average concentration of proteins regulating pro-inflammatory and T cell effector pathways between different patient/donor groups. (e-f) Correlation matrices of the 35-protein panel for Heme COVID+ patients (e) and Non-Heme cancer COVID+ patients (f). Only significant correlations (<0.05) are represented as dots. Pearson’s correlation coefficients from comparisons of protein concentrations across all the patients in specific groups are visualized by color intensity. Proteins were ordered by hierarchical clustering. (g) ROC curve for level-of-care prediction based on the pro-inflammatory protein concentrations of COVID-19 infected patients. A binomial logistic regression was used to fit the model, and a stratified fivefold cross-validation was implemented to compute the ROC and AUC. (h-i) Comparisons of the concentration level of specific proteins between COVID-19 infected groups and vaccinated groups. P values were calculated with two-tailed Mann-Whitney test. (* P < 0.05, ** P < 0.01, *** P < 0.001, **** P < 0.0001). ICU, Intensive Care Unit; ROC, receiver operator characteristic; AUC, area under the curve. UMAP, Uniform Manifold Approximation and Projection.
Figure 5.
Figure 5.. Vaccination induced circulating IgG antibody response in each patient and donor group.
(a-b) Comparisons of the concentration of anti-spike (a) and anti-RBD (b) IgG binding against wild type or other variants between different timepoints post-vaccination. (c-e) Correlation matrices of the 10 SARS-CoV-2 serology panels at Visit 1 and Visit 3 in healthy donors (c); Non-Heme cancer patients (d); and autoimmune (B cell depleted) patients (e). Only significant correlations (<0.05) are represented as dots. Pearson’s correlation coefficients from comparisons of IgG antibody concentrations across all the patients in specific group are visualized by color intensity. Antibodies are listed in order of the variants’ appearance. (f) Comparisons of the IgG antibody response rates between different timepoints post-vaccination in each group. (g) Comparisons of the IgG antibody response rates between patient/donor groups at each timepoint post-vaccination. Visit 1, two weeks after the first vaccine dose; Visit 2, 0~3 days before the second vaccine dose; Visit 3, two weeks after the second vaccine dose. P values were calculated with two-tailed Mann-Whitney test. (* P < 0.05, ** P < 0.01, *** P < 0.001, **** P < 0.0001).
Figure 6
Figure 6. COVID-19 infected hematologic malignancy patients exhibit limited RBD-specific binding.
(a) Comparison of the SARS-CoV-2 nucleocapsid (N) protein binding between COVID infected and post-vaccinated groups. (b) Comparisons of the concentration of anti-spike and anti-RBD binding against wild type and subsequent variants between COVID infected and post-vaccination groups. (c) Comparison of the IgG antibody response rates between COVID infected patients with hematological cancer or other types of cancer. (d) Correlation matrices of the 10 SARS-CoV-2 serology panels in COVID infected Heme patients and Non-Heme cancer patients. Only significant correlations (<0.05) are represented as dots. Pearson’s correlation coefficients from comparisons of IgG antibody concentrations across all the patients in specific groups are visualized by color intensity. Antibodies are listed in order of the variants’ appearance. (e-f) SARS-CoV-2 IgG binding antibody titers in ICU or after recovery from one Heme COVID+ (e) and one Non-Heme cancer COVID+ patient (f). P values were calculated with two-tailed Mann-Whitney test. (* P < 0.05, ** P < 0.01, *** P < 0.001, **** P < 0.0001). BAU, Binding Antibody Units; ICU, Intensive Care Unit.
Figure 7.
Figure 7.. Single-cell RNA and BCR sequencing identifies low clonotype diversity and functional deficiency in B cells from the patient with hematologic cancer.
(a) The percentage of top 5 clonotypes in each sample. (b) UMAP clustering of B cells from COVID infected Heme patient and Non-Heme cancer patient (two timepoints, in ICU and after recovery) identified 7 distinct subpopulations. (c) Dotplot of selected B cell marker gene expression in each cluster. The size of each circle represents proportion of single cells expressing the gene, and the color shade indicates normalized expression levels. (d) Cell proportion of each sample in each identified cluster. (e) Comparison of expression levels of marker genes in each sample. (f) Corresponding canonical pathways regulated by the highly differentially expressed genes between Heme patient vs. Non-Heme cancer patient (ICU). Pathway terms are ranked by −log 10 (P value). The side listed gene names represent top 6 symbolic molecular markers related to the pathway. A statistical quantity, called score, is computed and used to characterize the activation level score reflects the predicted activation level (z < 0, downregulated; z> 0, upregulated; z ≥ 2 or z ≤ −2 can be considered significant). P values were calculated with two-tailed Mann-Whitney test. (* P < 0.05, ** P < 0.01, *** P < 0.001, **** P < 0.0001). BCR, B cell repertoires; ICU, Intensive Care Unit. UMAP, Uniform Manifold Approximation and Projection.

References

    1. Wang K. et al. Memory B cell repertoire from triple vaccinees against diverse SARS-CoV-2 variants. Nature 603, 919–925, doi:10.1038/s41586-022-04466-x (2022). - DOI - PMC - PubMed
    1. Abdul-Jawad S. et al. Acute Immune Signatures and Their Legacies in Severe Acute Respiratory Syndrome Coronavirus-2 Infected Cancer Patients. Cancer Cell 39, 257–275 e256, doi:10.1016/j.ccell.2021.01.001 (2021). - DOI - PMC - PubMed
    1. Mehta V. et al. Case Fatality Rate of Cancer Patients with COVID-19 in a New York Hospital System. Cancer Discov 10, 935–941, doi:10.1158/2159-8290.CD-20-0516 (2020). - DOI - PMC - PubMed
    1. Robilotti E. V. et al. Determinants of COVID-19 disease severity in patients with cancer. Nat Med 26, 1218–1223, doi:10.1038/s41591-020-0979-0 (2020). - DOI - PMC - PubMed
    1. Andrews N. et al. Covid-19 Vaccine Effectiveness against the Omicron (B.1.1.529) Variant. New England Journal of Medicine 386, 1532–1546, doi:10.1056/NEJMoa2119451 (2022). - DOI - PMC - PubMed

Publication types