. 2022 Aug 25:16:887633.
doi: 10.3389/fncom.2022.887633. eCollection 2022.

Deep attention super-resolution of brain magnetic resonance images acquired under clinical protocols

Affiliations

Deep attention super-resolution of brain magnetic resonance images acquired under clinical protocols

Bryan M Li et al. Front Comput Neurosci. .

Abstract

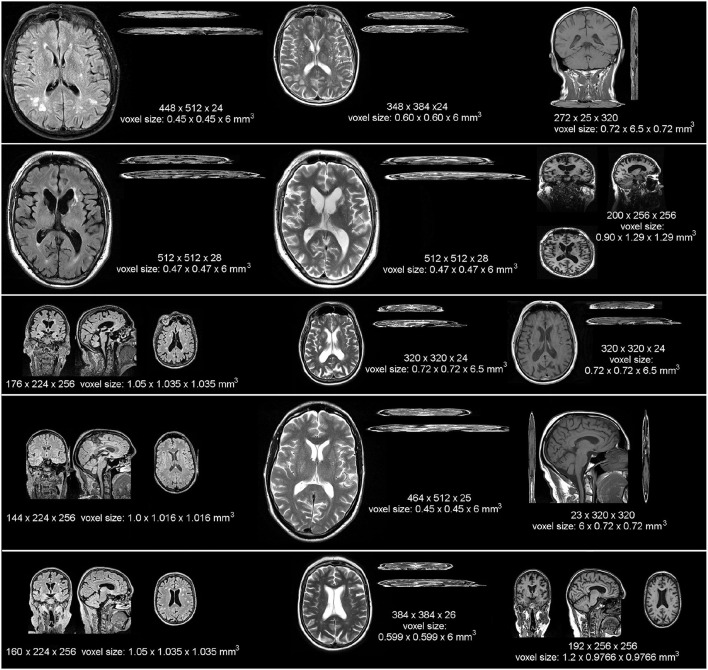
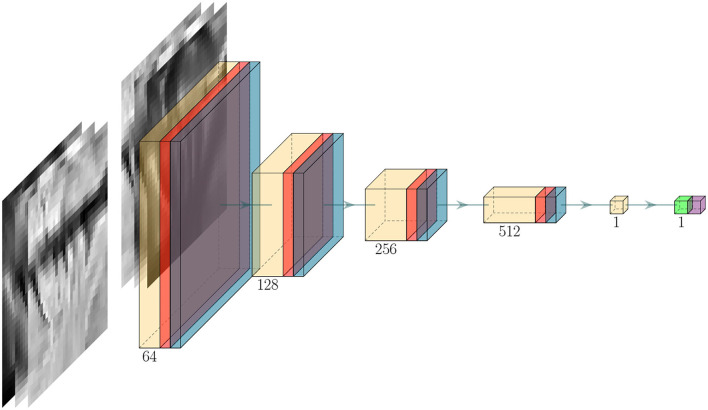
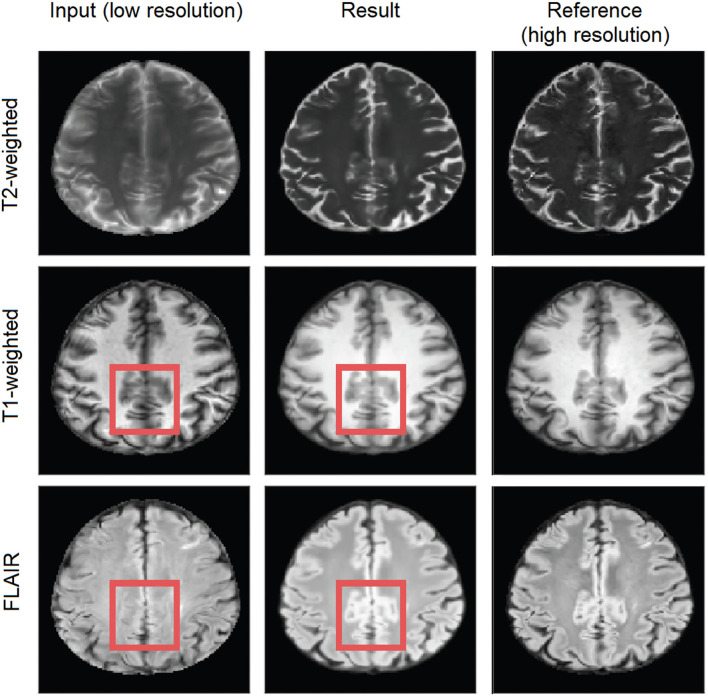
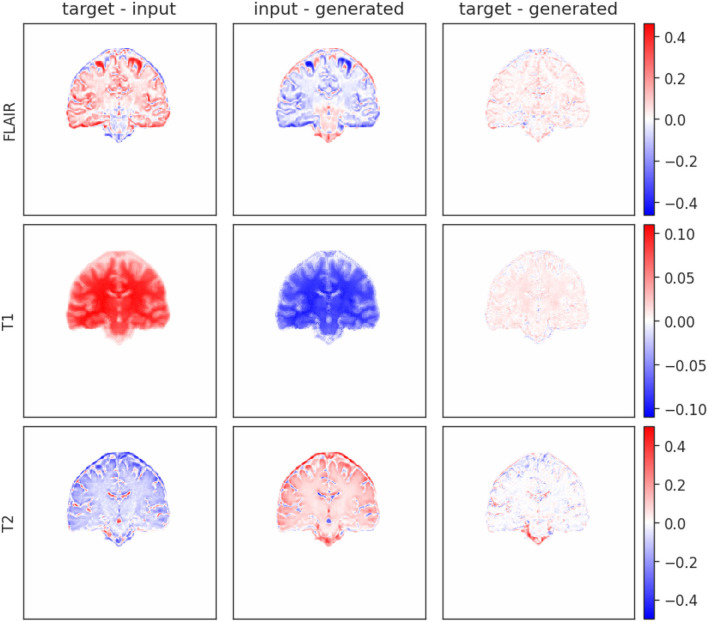
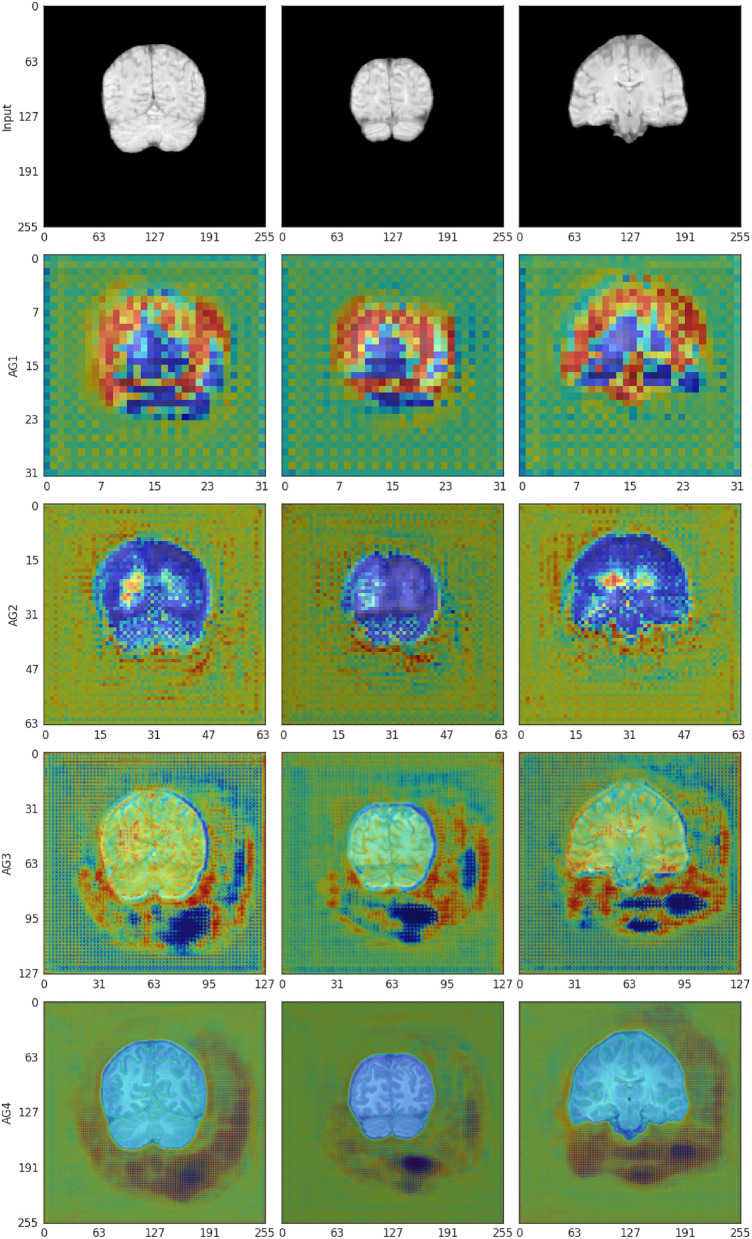
Vast quantities of Magnetic Resonance Images (MRI) are routinely acquired in clinical practice but, to speed up acquisition, these scans are typically of a quality that is sufficient for clinical diagnosis but sub-optimal for large-scale precision medicine, computational diagnostics, and large-scale neuroimaging collaborative research. Here, we present a critic-guided framework to upsample low-resolution (often 2D) MRI full scans to help overcome these limitations. We incorporate feature-importance and self-attention methods into our model to improve the interpretability of this study. We evaluate our framework on paired low- and high-resolution brain MRI structural full scans (i.e., T1-, T2-weighted, and FLAIR sequences are simultaneously input) obtained in clinical and research settings from scanners manufactured by Siemens, Phillips, and GE. We show that the upsampled MRIs are qualitatively faithful to the ground-truth high-quality scans (PSNR = 35.39; MAE = 3.78E-3; NMSE = 4.32E-10; SSIM = 0.9852; mean normal-appearing gray/white matter ratio intensity differences ranging from 0.0363 to 0.0784 for FLAIR, from 0.0010 to 0.0138 for T1-weighted and from 0.0156 to 0.074 for T2-weighted sequences). The automatic raw segmentation of tissues and lesions using the super-resolved images has fewer false positives and higher accuracy than those obtained from interpolated images in protocols represented with more than three sets in the training sample, making our approach a strong candidate for practical application in clinical and collaborative research.

Keywords: Magnetic Resonance Imaging; U-Net; brain imaging; deep learning; explainable artificial intelligence; generative adversarial networks; image reconstruction; super-resolution.


Conflict of interest statement

The authors declare that the research was conducted in the absence of any commercial or financial relationships that could be construed as a potential conflict of interest.

Figures

Figure 1
Figure 1
Example images from each MRI scanner and acquisition protocol (in terms of spatial resolution and sequence orientation) that provided low resolution data for our analyses, displayed at the same scale to appreciate the heterogeneity in the native resolution and in terms of image contrast and orientation (i.e., 2D, 3D, sagittal, axial, or coronal). In ascending order from top to bottom, the protocols displayed are referred in the text as protocols 1 to 5.
Figure 2
Figure 2
Scheme of the complete workflow of our super-resolution (SR) framework. Green colored blocks indicate pre- and post-processing operations, gray colored blocks indicate deep learning (DL) models, purple colored blocks indicate optimizers for the DL models, light blue colored blocks indicate low-resolution (LR) data, orange colored blocks indicate high-resolution (HR) data, yellow colored blocks indicate super-resolution (SR) data, and red colored blocks indicate loss calculations. Arrow lines indicate the flow of the data and the number next to them indicates the order of the data flow. Note that some operations are performed concurrently.
Figure 3
Figure 3
Up-sampling model G architecture. The two-shaded yellow block denotes a convolutional block, which consists of a convolutional layer followed by a normalization layer and an activation layer. The orange, dark-blue, green, and purple blocks denote the down-sample, up-sample, and output activation layer, respectively. The green arrow between each block represents the flow of the data and the purple arrow above represents the residual connection. The number below each block indicates the number of filters used in the corresponding block.
Figure 4
Figure 4
Critic architecture. Yellow, red, light blue, light green, and purple block denote convolutional, activation, dropout, dense, and output activation layer, respectively. The green arrow between each block represents the flow of data and the number below each block indicates the number of filters used in the corresponding block.
Figure 5
Figure 5
Axial slice of a scan in the test subsample. The left hand-side column shows the input low-resolution image sequences, the middle shows the generated (output), and the right hand-side column shows the target high-resolution images. The red square represents an area of possible inter-channel pass-through information.
Figure 6
Figure 6
Input, generated (i.e., upsampled), and target mid-coronal slices from a scan-set with low-resolution images acquired with protocol labeled as 2. The left hand-side column shows the input images, the middle column shows the generated (output) images from Model 0 and the right hand-side column shows the target images.
Figure 7
Figure 7
Difference map of input, target, and generated mid-coronal images upsampled using Model 0 from an MRI scan acquired with the protocol labeled as 2. The left hand-side column is the difference between target and input, the middle is between the input and the generated and the right is between target and generated.
Figure 8
Figure 8
The self-learned attention masks from AG 1-4 in the self-attention Upsampler for affine-registered scans (Model 0). The attention mask is represented in a jet colormap, with areas of high attention in red and low attention in blue.
Figure 9
Figure 9
GradCAM activation plots for the Critic for affine-registered scans. Activation is represented in a JET colormap, with areas of high activation in red and low attention in blue.
Figure 10
Figure 10
Bland-Altman plots of the agreement between the volumetric measurements obtained from the high-resolution images, and the images upsampled by different procedures, using the same scripts with identical parameters. The horizontal axes represent the average volume between the two volumetric measurements compared expressed in ml. The vertical axes represent the percentage difference between the volumetric measurement obtained from the upsampled image and the one obtained from the high-resolution (target) one, with respect to the mean value between the two measurements.
Figure 11
Figure 11
Coronal FLAIR slice of low resolution (left column) resampled and aligned to the high resolution image (right column) using trilinear interpolation, and the correspondent SR image (center column). Binary masks of CSF (red), pial layer (blue), and dural meninges and venous sinuses (green) are superimposed in the bottom row.
Figure 12
Figure 12
Axial FLAIR slice of low resolution (left column) resampled and aligned to the high resolution image (right column) using trilinear interpolation, and the correspondent SR image (center column). The bottom row shows the automatically generated binary masks of WMH superimposed in red for the low resolution and SR images, and in yellow for the high resolution image. The manually corrected WMH mask is also superimposed in the high resolution image and can be appreciated in an orange tone.
Figure 13
Figure 13
Box plots showing the full range, mean, median, and interquartile range of the volumetric measurements of CSF-filled spaces, venous sinuses, and pial layers/CFS-brain partial volume effects, for a subset of patients that underwent brain MRI scan at baseline, and subsequently, monthly up to 4 months after enrolling in the primary study that provided data for the present analysis.

Similar articles

Cited by

References

    1. Atkinson D., Hill D. L., Stoyle P. N., Summers P. E., Keevil S. F. (1997). Automatic correction of motion artifacts in magnetic resonance images using an entropy focus criterion. IEEE Trans. Med Imaging 16, 903–910. 10.1109/42.650886 - DOI - PubMed
    1. Bansal A., Ma S., Ramanan D., Sheikh Y. (2018). “Recycle-gan: unsupervised video retargeting,” in Proceedings of the European Conference on Computer Vision (ECCV) (Munich: ), 119–135.
    1. Bergstra J., Bengio Y. (2012). Random search for hyper-parameter optimization. J. Mach. Learn. Res. 13, 281–305.
    1. Bernal J., Valdés-Hernández M. d. C., Ballerini L., Escudero J., Jochems A. C., Clancy U., et al. . (2020). “A framework for jointly assessing and reducing imaging artefacts automatically using texture analysis and total variation optimisation for improving perivascular spaces quantification in brain magnetic resonance imaging,” in Annual Conference on Medical Image Understanding and Analysis (Oxford: Springer; ), 171–183.
    1. Bernal J., Valdés-Hernández M. d. C., Escudero J., Armitage P. A., Makin S., et al. . (2019). “Analysis of spatial spectral features of dynamic contrast-enhanced brain magnetic resonance images for studying small vessel disease,” in Annual Conference on Medical Image Understanding and Analysis (Liverpool: Springer; ), 282–293.

LinkOut - more resources