. 2022 Sep 6:13:20417314221119615.
doi: 10.1177/20417314221119615. eCollection 2022 Jan-Dec.

Therapeutic arteriogenesis by factor-decorated fibrin matrices promotes wound healing in diabetic mice

Affiliations

Therapeutic arteriogenesis by factor-decorated fibrin matrices promotes wound healing in diabetic mice

Rosalinda D'Amico et al. J Tissue Eng. .

Abstract

Chronic wounds in type-2 diabetic patients present areas of severe local skin ischemia despite mostly normal blood flow in deeper large arteries. Therefore, restoration of blood perfusion requires the opening of arterial connections from the deep vessels to the superficial skin layer, that is, arteriogenesis. Arteriogenesis is regulated differently from microvascular angiogenesis and is optimally stimulated by high doses of Vascular Endothelial Growth Factor-A (VEGF) together with Platelet-Derived Growth Factor-BB (PDGF-BB). Here we found that fibrin hydrogels decorated with engineered versions of VEGF and PDGF-BB proteins, to ensure protection from degradation and controlled delivery, efficiently accelerated wound closure in diabetic and obese db/db mice, promoting robust microvascular growth and a marked increase in feeding arterioles. Notably, targeting the arteriogenic factors to the intact arterio-venous networks in the dermis around the wound was more effective than the routine treatment of the inflamed wound bed. This approach is readily translatable to a clinical setting.

Keywords: PDGF-BB; VEGF; Wound-healing; angiogenesis; arteriogenesis; fibrin.


Conflict of interest statement

Declaration of conflicting interests: The author(s) declared the following potential conflicts of interest with respect to the research, authorship, and/or publication of this article: The fibrin gel immobilization scheme is the subject of patents upon which J.A.H. is named as inventor and has been licensed by a company in which J.A.H. is a shareholder.

Figures

Figure 1.
Figure 1.
Intradermal treatment with TG-VEGF+TG-PDGF-BB-decorated fibrin accelerates wound healing. (a–d) Full-thickness back-skin wounds of diabetic db/db mice were treated with fibrin gels containing 100 µg/mL TG-VEGF-A + 10 µg/mL of TG-PDGF-BB (VP) or no growth factors (fibrin alone controls, F), which were either layered on the exposed wound bed ((a and b), -layer) or divided in 4 intradermal injections around the wound rim ((c and d), -4inj). Images show the wounds 4 and 8 days after treatment (D4 and D8, respectively). (e and f) Quantification of the percentage of wound closure over time (e), and showing the individual measurements at day 8 as a scatter plot (f), both with mean ± SEM (n = 10 wounds per time-point per group). (g) Quantification of re-epithelialization 7 days after treatment by histomorphometric analysis of H&E-stained cryosections, showing the individual measurements with mean ±SEM (n = 6 wounds per group). *p < 0.05, **p < 0.01 for the indicated pairwise comparisons (one-way ANOVA with Holm-Sidak multiple comparisons test). Scale bars = 2 mm in all panels. F-layer = control fibrin layering; VP-layer = VEGF-A+PDGF-BB fibrin layering; F-4inj = control fibrin 4 injections; VP-4inj = VEGF-A+PDGF-BB fibrin 4 injections.
Figure 2.
Figure 2.
Intradermal treatment with TG-VEGF+TG-PDGF-BB-decorated fibrin stimulates angiogenesis. (a–h) Immunostaining with antibodies against CD31 (endothelial cells, red) and DAPI (nuclei, blue) on cryosections of back skin wounds 7 days after treatment. Images show the angiogenic effects in the peripheral areas ((a–d) Periphery) or in the wound center ((e–h), Center). Angiogenic areas are marked by yellow lines. (i and j) Total angiogenic areas were quantified separately in the periphery (i) or in the center (j) of the wounds. The scatter plots show individual measurements with mean ± SEM (n = 4). *p < 0.05 (one-way ANOVA with Holm-Sidak multiple comparisons test). Scale bars = 500 µm in all panels. F = control fibrin; VP = VEGF-A+PDGF-BB fibrin.
Figure 3.
Figure 3.
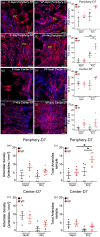
Intradermal treatment is more effective to promote total microvascular and arterial growth than topical delivery. Immunostaining for CD31 (endothelial cells, red) and with DAPI (nuclei, blue) on cryosections of back skin wounds 7 days after treatment. Images show the microvascular networks inside angiogenic areas in the periphery ((a–d), Periphery) or in the wound center ((g–j), Center). PC: panniculus carnosus muscle. (e, f, k and l) Microvessels were quantified in the angiogenic areas identified in Figure 2 and expressed as Vessel Length Density (VLD) or Total Vessel Length (TVL) in the peripheral areas (e and f) or in the wound center (k and l). (m–p) Quantification of the arteriolar density adjacent to the angiogenic areas (m and n) and of the total number of arterioles (o and p) in the periphery and center of the wounds. The scatter plots show individual measurements with mean ± SEM (n = 4–6). *p < 0.05, **p < 0.01 (one-way ANOVA with Holm-Sidak multiple comparisons test). Scale bars = 500 µm in all panels. F = control fibrin; VP = VEGF-A+PDGF-BB fibrin.
Figure 4.
Figure 4.
Efficacy of intradermal treatment with TG-VEGF+TG-PDGF-BB-decorated fibrin is not further improved by a double dose. (a and b) Full-thickness back-skin wounds treated with 8 intradermal injections of either control fibrin (F-8inj) or TG-VEGF+TG-PDGF-BB-decorated fibrin (VP-8inj), 4 and 8 days after treatment (D4 and D8, respectively). (c and d) Quantification of the percentage of wound closure over time (c), and showing the individual measurements of each wounded area at Day 8 as a scatter plot (d), both with mean ± SEM. (e) Quantification of the extent of re-epithelialization 7 days after treatment by histomorphometric analysis of H&E-stained cryosections. * p < 0.05, **p < 0.01 for the indicated pairwise comparisons (one-way ANOVA with Holm-Sidak multiple comparisons test; n = 10 wounds/time-point/group in (c and d) and n = 6 wounds/group in (e). Scale bars = 2 mm in all panels. F-8inj = control fibrin 8 injections; VP-8inj = VEGF+PDGFBB fibrin 8 injections; VP-layer = VEGF-A+PDGF-BB fibrin layering; VP-4inj = VEGF+PDGFBB fibrin 4 injections.
Figure 5.
Figure 5.
Total angiogenesis is maximal with 4 intradermal injections of TG-VEGF+TG-PDGF-BB-decorated fibrin. (a–d) Immunostaining with antibodies against CD31 (endothelial cells, red) and with DAPI (nuclei, blue) on cryosections of back skin wounds 7 days after treatment with 8 intradermal injections of control fibrin (F-8inj) or TG-VEGF+TG-PDGF-BB-decorated fibrin (VP-8inj). Angiogenic areas are marked by yellow lines. (e and f) Quantification of the total angiogenic area in the peripheral areas ((e), Periphery) or in the wound center ((f), Center). Scatter plots show individual values with mean ± SEM (n = 4). **p < 0.01 (one-way ANOVA with Holm-Sidak multiple comparisons test). Scale bars = 500 µm in all panels. F = control fibrin; VP = VEGF-A+PDGF-BB fibrin.
Figure 6.
Figure 6.
Total microvascular and arterial growth are maximal with 4 intradermal injections of TG-VEGF+TG-PDGF-BB-decorated fibrin. (a–d) Immunostaining with antibodies against CD31 (endothelial cells, red) and with DAPI (nuclei, blue) on cryosections of back skin wounds 7 days after treatment with 8 intradermal injections of control fibrin (F-8inj) or TG-VEGF+TG-PDGF-BB-decorated fibrin (VP-8inj). PC = Panniculus Carnosus muscle. (e–h) Quantification of Vessel Length Density (VLD, (e and f)) and Total Vessel Length (TVL, (g and h)) in the peripheral areas (Periphery) or in the wound center (Center). (i–l) Quantification of the arteriolar density adjacent to the angiogenic areas (i and j) and of the total number of arterioles (k and l) in the periphery and center of the wounds. Scatter plots show individual values with mean ± SEM (n = 4–6/group). *p < 0.05, **p < 0.01 (one-way ANOVA with Holm-Sidak multiple comparisons test). Scale bars = 100 µm in all panels. F = control fibrin; VP = VEGF-A+PDGF-BB fibrin.

References

    1. Saeedi P, Petersohn I, Salpea P, et al.. Global and regional diabetes prevalence estimates for 2019 and projections for 2030 and 2045: Results from the International Diabetes Federation Diabetes Atlas, 9(th) edition. Diabetes Res Clin Pract 2019; 157: 107843. - PubMed
    1. Zhang P, Lu J, Jing Y, et al.. Global epidemiology of diabetic foot ulceration: a systematic review and meta-analysis. Ann Med 2017; 49: 106–116. - PubMed
    1. Armstrong DG, Boulton AJM, Bus SA. Diabetic foot ulcers and their recurrence. N Engl J Med 2017; 376: 2367–2375. - PubMed
    1. Saluja S, Anderson SG, Hambleton I, et al.. Foot ulceration and its association with mortality in diabetes mellitus: a meta-analysis. Diabet Med 2020; 37: 211–218. - PubMed
    1. Altabas V. Diabetes, endothelial dysfunction, and vascular repair: what should a diabetologist keep his eye on? Int J Endocrinol 2015; 2015: 848272. - PMC - PubMed

LinkOut - more resources