. 2022 Aug;11(8):2713-2732.
doi: 10.21037/tcr-22-218.

E2F1 as a potential prognostic and therapeutic biomarker by affecting tumor development and immune microenvironment in hepatocellular carcinoma

Affiliations

E2F1 as a potential prognostic and therapeutic biomarker by affecting tumor development and immune microenvironment in hepatocellular carcinoma

Zhibo Tan et al. Transl Cancer Res. 2022 Aug.

Abstract

Background: E2F1 plays a crucial role in cell cycle regulation. However, the exact role of E2F1 in liver hepatocellular carcinoma (LIHC) remains controversial. This study aimed to integrate disparate data by bioinformatics for a deeper insight into the possible roles of E2F1 in LIHC.

Methods: Differentially overexpressed genes in LIHC were screened by GEO2R. Gene ontology and Kyoto Encyclopedia of Genes and Genomes (KEGG) pathway were analyzed by WebGestalt. Then, hub genes were selected via STRING and Cytoscape, followed by validation with Oncomine, GEPIA2, and Human Protein Atlas (HPA). Next, E2F1 expression was investigated using Oncomine, GEPIA2, TIMER2.0, UALCAN, and HPA. Then, Kaplan-Meier plotter was adopted to investigate survival. After that, E2F1 promotor methylation, mutations and copy number alterations were analyzed with UALCAN and cBioPortal. Moreover, competing endogenous RNAs (ceRNAs) network were established using ENCORI, miRCancer, and Kaplan-Meier plotter. Additionally, the association between E2F1 and immune microenvironment was investigated through TISCH and TIMER2.0.

Results: Six hub genes including E2F1 were identified. E2F1 was overexpressed in most solid cancers including LIHC. E2F1 overexpression was correlated with poor prognosis in LIHC. Copy number alterations could positively affect E2F1 expression. Moreover, ceRNAs network was established with 3 long non-coding RNAs (lncRNAs) named AC025048.4, AC090114.2, and AC092171.5, as well as 4 microRNAs (miRNAs) including miR-150-5p, miR-302c-3p, miR-520d-3p, and miR-330-5p. Single cell sequencing data showed that E2F1 was mainly expressed in malignant cells and proliferating T cells, and that E2F targets almost exclusively enriched in proliferating T cells. Besides, there existed a positive correlation between E2F1 and certain immune cells including CD8(+) T cells, CD4(+) T cells, B cells, macrophages, and dendritic cells.

Conclusions: This study elucidated that E2F1 could affect tumor development and immune microenvironment in LIHC. Thus, E2F1 might be a potential prognostic biomarker and therapeutic target for LIHC.

Keywords: E2F1; hepatocellular carcinoma; prognosis; therapeutic target; tumor microenvironment.


Conflict of interest statement

Conflicts of Interest: All authors have completed the ICMJE uniform disclosure form (available at https://tcr.amegroups.com/article/view/10.21037/tcr-22-218/coif). ZT reports grants from the Natural Science Foundation of Guangdong Province (No. 2018A030313530); the Chinese Scholarship Council (No. 201908440010); the Shenzhen Science and Technology Innovation Commission Project (No. JCYJ20210324110408022); and the Beijing Bethune Charitable Foundation (No. flzh202120). YL reports grants from the Shenzhen Science and Technology Innovation Commission Project (Nos. GJHZ20180420180754917, ZDSYS20190902092855097, KCXFZ20200201101050887 and GJHZ20200731095207023); and the Shenzhen Sanming Project (No. SZSM201612041). The authors have no other conflicts of interest to declare.

Figures

Figure 1
Figure 1
Flowchart of brief study process. DEGs, differentially expressed genes; LIHC, liver hepatocellular carcinoma; GEO, Gene Expression Omnibus; KEGG, Kyoto Encyclopedia of Genes and Genomes; HPA, Human Protein Atlas; CNAs, copy number alterations.
Figure 2
Figure 2
Hub genes selection in LIHC. (A) Venn diagram showed 100 differentially overexpressed genes identified from 2 GEO series; (B) biological processes enrichment of differentially overexpressed genes; (C) cellular component enrichment of differentially overexpressed genes; (D) molecular function enrichment of differentially overexpressed genes; (E) KEGG pathway enrichment of differentially overexpressed genes; (F) PPI network and hub genes. LIHC, liver hepatocellular carcinoma; GEO, Gene Expression Omnibus; KEGG, Kyoto Encyclopedia of Genes and Genomes; PPI, protein-protein interaction.
Figure 3
Figure 3
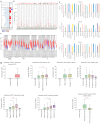
Hub genes validation in LIHC. (A) The expression of 6 hub genes in 4 LIHC datasets via Oncomine; (B) the expression of 6 hub genes in LIHC via GEPIA; (C) the immunohistochemistry images of 6 hub genes via HPA. LIHC, liver hepatocellular carcinoma; HPA, Human Protein Atlas.
Figure 4
Figure 4
E2F1 mRNA and protein expression levels in various cancers including LIHC. (A-C) E2F1 mRNA expression levels in various cancers via Oncomine, GEPIA2, and TIMER2.0; (D) UALCAN showed E2F1 mRNA expression levels in LIHC and corresponding normal liver tissue, associated with clinicopathological characteristics of race, gender, age, cancer stage, tumor grade, as well as TP53 mutation status; (E) HPA database showed E2F1 protein expression level in various cancers examined by different antibodies including HPA008003, CAB000329, and CAB019308. Blue * in box represents comparison to normal liver tissue group; red * above whisker represents comparison between indicated groups. *P<0.05, **P<0.01, ***P<0.001. LIHC, liver hepatocellular carcinoma; HPA, Human Protein Atlas.
Figure 5
Figure 5
The relationship between E2F1 expression level and survival. (A-D) The Kaplan-Meier survival curves for overall survival (OS), disease-specific survival (DSS), progression-free survival (PFS), relapse-free survival (RFS) respectively; (E) multivariate analyses of overall survival by Cox regression analysis. LIHC, liver hepatocellular carcinoma.
Figure 6
Figure 6
E2F1 promotor methylation level, mutations and CNAs in LIHC. (A) E2F1 promotor methylation level in LIHC and normal liver tissue. (B) The correlation between promotor methylation level and mRNA expression level of E2F1. (C) E2F1 mutation frequency of 3 LIHC cohort. (D) E2F1 mutation types. (E) E2F1 CNAs frequency of 2 LIHC cohort. (F) E2F1 mRNA expression level in different CNAs status groups in TCGA Firehose Legacy study. (G) The correlation between CNAs and mRNA expression level of E2F1 in TCGA Firehose Legacy Study. ns, P>0.05; **P<0.01. CNAs, copy number alterations; LIHC, liver hepatocellular carcinoma; HPA, Human Protein Atlas.
Figure 7
Figure 7
ceRNAs network of E2F1. (A-C) The correlation between expression level of E2F1 mRNA and expression level of lncRNAs including AC025048.4, AC090114.2, and AC092171.5 respectively; (D-G) overall survival in different expression level groups of miRNAs including miR-150-5p, miR-302c-3p, miR-520d-3p, and miR-330-5p; (H) ceRNAs network of E2F1 in LIHC. ceRNAs, competing endogenous RNAs; lncRNAs, long non-coding RNAs; miRNAs, microRNAs; LIHC, liver hepatocellular carcinoma.
Figure 8
Figure 8
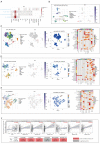
The association between E2F1 and tumor immune microenvironment explored via single cell sequencing data from TISCH database. (A) The heatmap of E2F1 expression levels in different types of cell clusters of 4 LIHC datasets; (B) E2F1 expression pattern in the LIHC_GSE125449_aPDL1aCTLA4s dataset showed that E2F1 expressed in malignant cell cluster; (C-E) the E2F1 expression pattern, the enrichment of E2F targets, and the hallmark of upregulated genes in different cell clusters investigated from 3 datasets, namely LIHC_GSE140228_10X, LIHC_GSE140228_Smartseq2, and LIHC_GSE98638; (F) the correlations between E2F1 expression and infiltrations of different immune cells in LIHC analyzed via TIMER2.0 database. Red arrows indicate E2F1 expression in malignant cell cluster or proliferating T cell cluster. LIHC, liver hepatocellular carcinoma.

Similar articles

Cited by

References

    1. Sung H, Ferlay J, Siegel RL, et al. Global Cancer Statistics 2020: GLOBOCAN Estimates of Incidence and Mortality Worldwide for 36 Cancers in 185 Countries. CA Cancer J Clin 2021;71:209-49. 10.3322/caac.21660 - DOI - PubMed
    1. McGlynn KA, Petrick JL, El-Serag HB. Epidemiology of Hepatocellular Carcinoma. Hepatology 2021;73 Suppl 1:4-13. 10.1002/hep.31288 - DOI - PMC - PubMed
    1. Llovet JM, Montal R, Sia D, et al. Molecular therapies and precision medicine for hepatocellular carcinoma. Nat Rev Clin Oncol 2018;15:599-616. 10.1038/s41571-018-0073-4 - DOI - PubMed
    1. Ding J, Wen Z. Survival improvement and prognosis for hepatocellular carcinoma: analysis of the SEER database. BMC Cancer 2021;21:1157. 10.1186/s12885-021-08904-3 - DOI - PMC - PubMed
    1. Anwanwan D, Singh SK, Singh S, et al. Challenges in liver cancer and possible treatment approaches. Biochim Biophys Acta Rev Cancer 2020;1873:188314. 10.1016/j.bbcan.2019.188314 - DOI - PMC - PubMed