. 2023 Feb 13;146(2):561-575.
doi: 10.1093/brain/awac319.

Local neuronal excitation and global inhibition during epileptic fast ripples in humans

Affiliations

Local neuronal excitation and global inhibition during epileptic fast ripples in humans

Jonathan Curot et al. Brain. .

Abstract

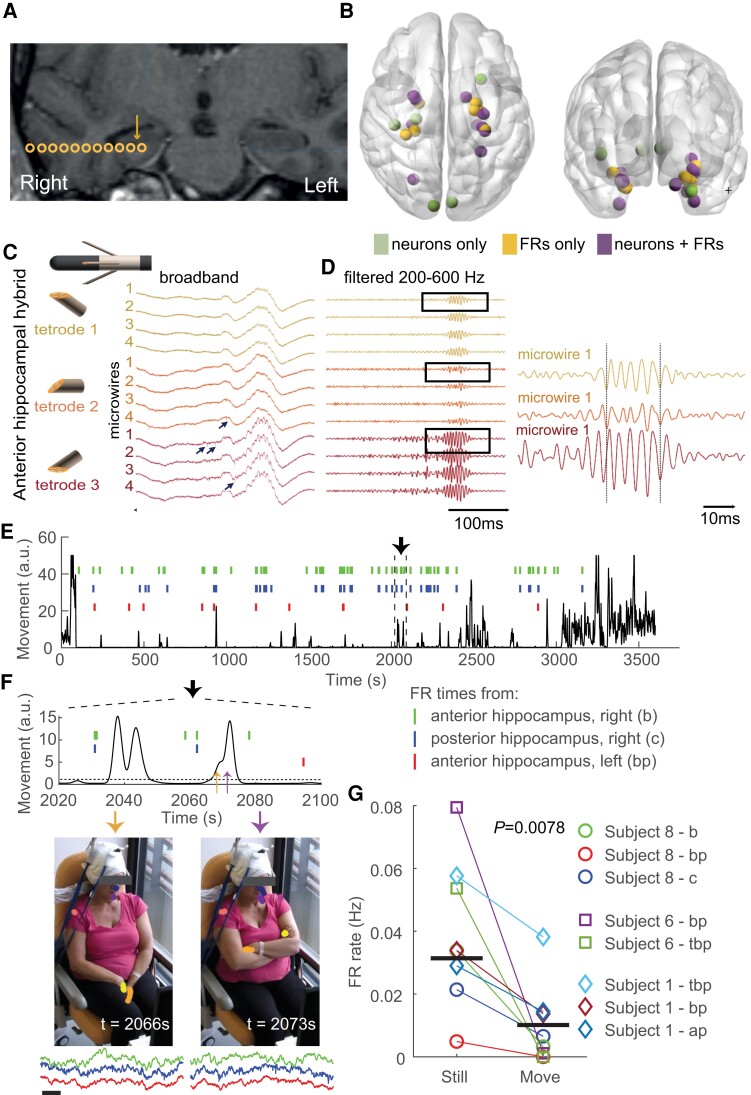
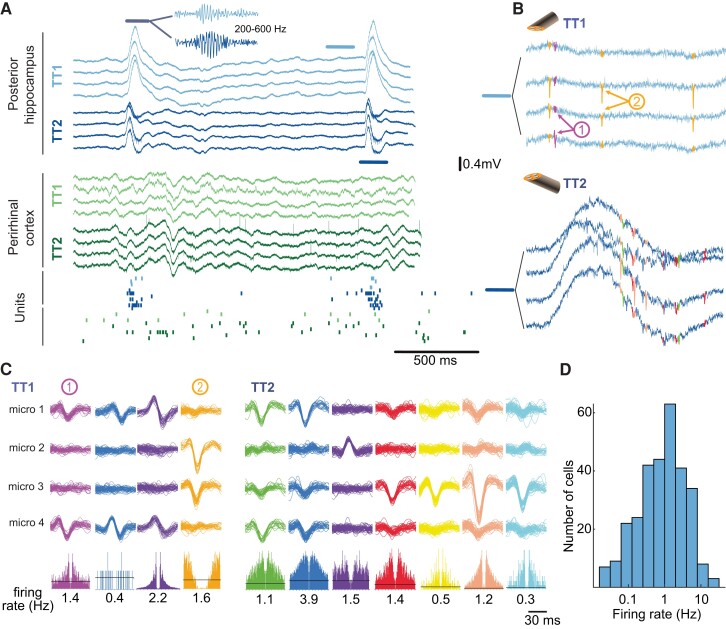
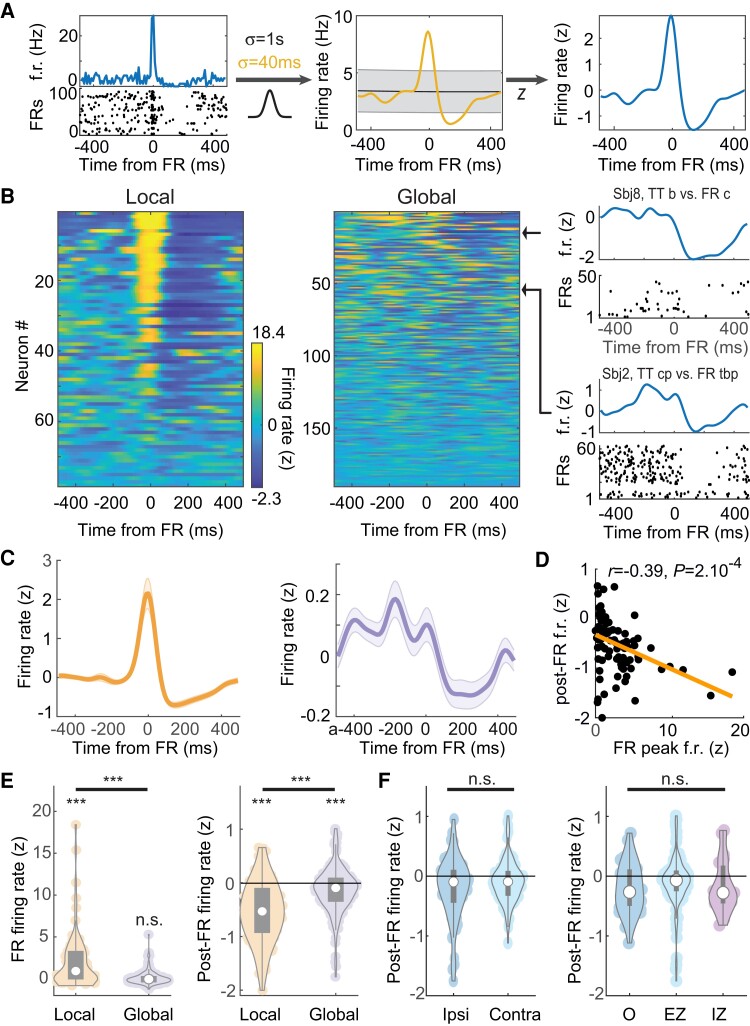
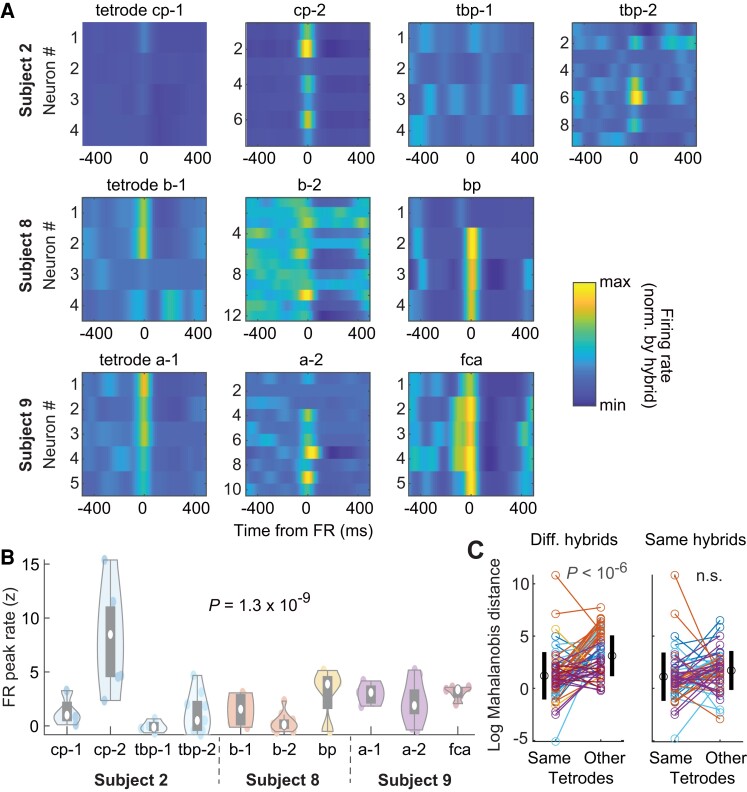
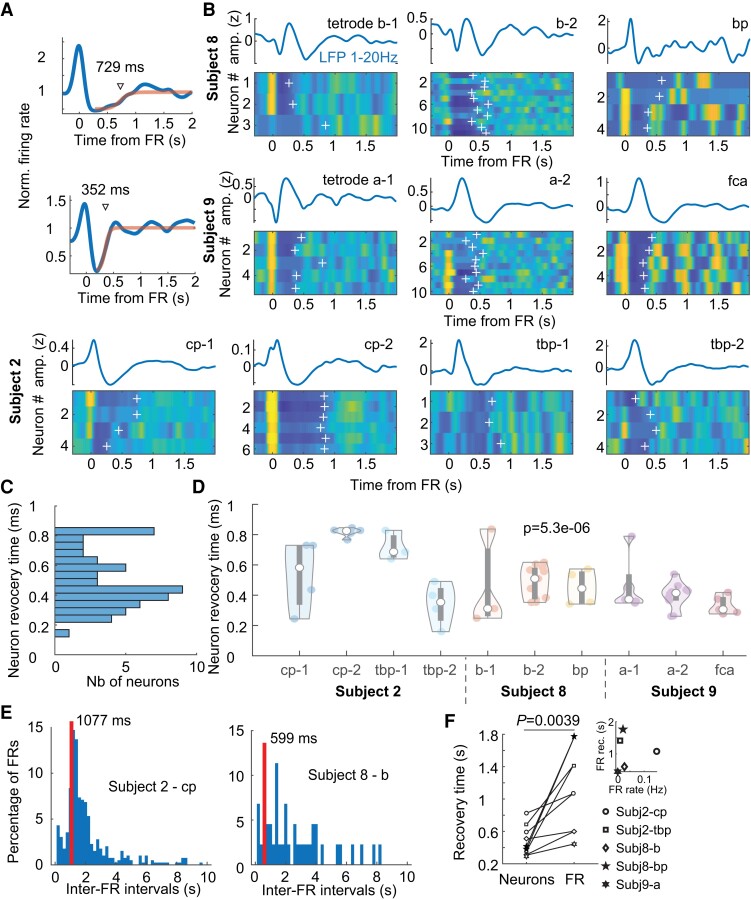
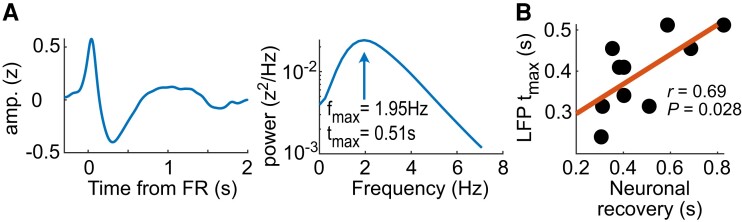
Understanding the neuronal basis of epileptic activity is a major challenge in neurology. Cellular integration into larger scale networks is all the more challenging. In the local field potential, interictal epileptic discharges can be associated with fast ripples (200-600 Hz), which are a promising marker of the epileptogenic zone. Yet, how neuronal populations in the epileptogenic zone and in healthy tissue are affected by fast ripples remain unclear. Here, we used a novel 'hybrid' macro-micro depth electrode in nine drug-resistant epileptic patients, combining classic depth recording of local field potentials (macro-contacts) and two or three tetrodes (four micro-wires bundled together) enabling up to 15 neurons in local circuits to be simultaneously recorded. We characterized neuronal responses (190 single units) with the timing of fast ripples (2233 fast ripples) on the same hybrid and other electrodes that target other brain regions. Micro-wire recordings reveal signals that are not visible on macro-contacts. While fast ripples detected on the closest macro-contact to the tetrodes were always associated with fast ripples on the tetrodes, 82% of fast ripples detected on tetrodes were associated with detectable fast ripples on the nearest macro-contact. Moreover, neuronal recordings were taken in and outside the epileptogenic zone of implanted epileptic subjects and they revealed an interlay of excitation and inhibition across anatomical scales. While fast ripples were associated with increased neuronal activity in very local circuits only, they were followed by inhibition in large-scale networks (beyond the epileptogenic zone, even in healthy cortex). Neuronal responses to fast ripples were homogeneous in local networks but differed across brain areas. Similarly, post-fast ripple inhibition varied across recording locations and subjects and was shorter than typical inter-fast ripple intervals, suggesting that this inhibition is a fundamental refractory process for the networks. These findings demonstrate that fast ripples engage local and global networks, including healthy tissue, and point to network features that pave the way for new diagnostic and therapeutic strategies. They also reveal how even localized pathological brain dynamics can affect a broad range of cognitive functions.

Keywords: epilepsy; high frequency oscillations; micro-electrodes; single unit; tetrodes.


Figures

Figure 1
Figure 1
Recording of intracerebral signals with micro-wires at a high sampling rate reveals local FRs and action potentials. (A) Example of a hybrid electrode location in one subject (Subject 8). Coronal co-registration MRI CT scan (preoperative 3D T1 MRI with gadolinium and postoperative CT scan). Circles are macro-contacts; the arrow specifies the putative location of tetrodes between the two deepest macro-contacts of the hybrid electrode. (B) Locations of every tetrode included in the study, referenced in the MNI space. Colours indicate whether FRs, single units (neurons) or both were detected. See Table 1 for complete list of locations. (C) Schematic representation of the deepest macro-contacts and the three tetrodes and example LFP traces (broadband) from the three tetrodes of a hybrid electrode targeting the right anterior hippocampus (Subject 8). The IED (positive deflection) is associated with an FR. Note that both IED and FR amplitude are higher on the third tetrode. Black arrows indicate action potentials. (D) Left, Same signals as in C filtered in the FR frequency band (200–600 Hz). Note that FRs have the same morphological features on the four micro-wires of each tetrode. Right, Zoomed trace of the first micro-wire of each tetrode. Although FRs occur at the same time, moment-to-moment phase difference varies. (E) Subject’s upper body movement (see ‘Materials and methods’ section) and occurrence times of FRs on three hybrid electrodes during a 1-h long recording. (F) Top, Temporal zoom of the traces in E (delimited by vertical dotted lines). Bottom, Two video frames extracted at times indicated by the orange and purple arrows in the top panel. Note the markers on the head, shoulders and hands. Examples of micro-wire recordings from the three depth electrodes showing FRs, centred around the time of video frame, are shown below (same colour ticks depicting FR times). Scale bar = 100 ms. (G) FR occurrence rate during stillness and movement for all three subjects with video tracking. Horizontal bars indicate median values.
Figure 2
Figure 2
FR and spikes in local and global circuits. (A) LFP recordings (unfiltered broadband signal) on two hybrid electrodes in Subject 2. Two IEDs are visible in the posterior hippocampus, one in the perirhinal cortex. IEDs were associated with FRs, as shown in the inset (200–600 Hz filtered LFP trace). Bottom, raster plot of neuronal activity. Each row corresponds to one unit and each dot to one action potential. There is an increase in firing in most units during the IED and FR recording on TT1 and TT2 located in the posterior hippocampus (blue and purple dots). (B) Action potentials recorded on the posterior hippocampus on TT1 and TT2 immediately before the highlighted FR in A (TT1) and during the FR (TT2). Note the FR in the broadband on the TT2 trace. (C) Sample waveforms of action potentials recorded on TT1 and TT2 in the posterior hippocampus, sorted into putative single units. Bottom, auto-correlogram (± 30 ms) and mean firing rate of each single unit. (D) Distribution of single unit firing rates (log scale).
Figure 3
Figure 3
Local and global modulation of neuronal activity with FRs. (A) Normalization of a sample single unit cross-correlogram relative to time of FRs. Time 0 corresponds to the occurrence of FRs. Left, Mean firing rate (f.r.) of the neuron relative to FR occurrence time (top) and raster plot of FR-by-FR spiking activity (bottom); middle, the cross-correlogram is convolved with two Gaussian filters of different width; right, the Z-scored normalized firing rate (see ‘Materials and methods’ section). (B) Normalized cross-correlograms of each single unit recorded at the local (same hybrid as FR) and global scale (different hybrid) relative to FRs. Colours display Z-scored firing rates. Cross-correlograms are sorted by their overall variance, from maximum (top) to minimum (bottom). Right, Two sample single units at the global range (titles indicate location of hybrids from which neuron and FRs were recorded). (C) Average local (left) and the global (right) cross-correlograms. (D) Post-FR firing rates as a function of FR peak firing rates in local networks. (E) Left, FR local and global peak firing rates; right, same for post-FR firing rates. (F) Left, Post-FR global firing rates for ipsi- and contralaterally located hybrid electrodes (i.e. hybrids on which FRs and neurons were monitored). Right, Same for the different statuses of the neuron-recording hybrid electrodes (O, healthy tissue). In E and F, white circles indicate the median, and grey rectangles the distribution of the first two quartiles around the median.
Figure 4
Figure 4
Neuronal modulation by FRs in local networks. (A) Tetrode-by-tetrode neuronal cross-correlograms in three subjects (total of 6 hybrid electrodes and 60 single units). Colour indicates Z-scored firing rates from minimum (blue) to maximum (yellow) on each hybrid electrode. (B) Distribution of tetrode-by-tetrode peak FR firing rates. White circles indicate the median and grey rectangles the distribution of the first two quartiles around the median. (C) Comparison of cross-correlogram profiles (i.e. after compressing extreme values) between neurons of the same tetrodes or other tetrodes (see ‘Materials and methods’ section). Left, log Mahalanobis distance from each neuron to all other neurons from the same tetrodes and average distance to tetrodes on other hybrid electrodes. Black circles and vertical lines on the sides show average and SD, respectively. Right, Same as left but within tetrode distance in comparison to average distance to tetrodes from the same hybrid. Colour of each neuron indicates hybrid electrode of origin, as in B.
Figure 5
Figure 5
Post-FR recovery of local network states. (A) Identification of post-FR neuronal recovery time by fitting post-FR neuronal cross-correlograms with sigmoids. Cross-correlograms are normalized to the neuron’s session-wide average firing rate. (B) Tetrode-by-tetrode post-FR neuronal cross-correlograms in three subjects (total of 6 hybrid electrodes and 55 units with a significant sigmoid fit in the 50–1500 ms range). White crosses indicate recovery time (obtained as in A). (C) Distribution of neuronal recovery time in three subjects. (D) Distribution of tetrode-by-tetrode recovery times (same presentation as in Fig. 4B). (E) Inter-FR interval distribution from two hybrid electrodes (two subjects). (F) Hybrid-by-hybrid neuronal and FR recovery times. Inset, FR recovery time as a function of FR occurrence rate (r = 0.06; P = 0.9; Pearson’s correlation).
Figure 6
Figure 6
Post-FR recovery of neuronal activity correlates with FR-triggered IED shape. (A) Left, An example of FR-triggered IED (Subject 2-cp1); right, power spectrum of the IED, showing a local maximum that determines tmax, the typical duration of the IED. (B) Typical duration of the IED as a function of post-FR neuronal recovery time.

References

    1. Binnie CD. Cognitive impairment during epileptiform discharges: Is it ever justifiable to treat the EEG? Lancet Neurol. 2003;2:725–730. - PubMed
    1. Ewell LA, Fischer KB, Leibold C, Leutgeb S, Leutgeb JK. The impact of pathological high-frequency oscillations on hippocampal network activity in rats with chronic epilepsy. eLife. 2019;8:e42148. - PMC - PubMed
    1. Gelinas JN, Khodagholy D, Thesen T, Devinsky O, Buzsáki G. Interictal epileptiform discharges induce hippocampal-cortical coupling in temporal lobe epilepsy. Nat Med. 2016;22:641–648. - PMC - PubMed
    1. Holmes GL, Lenck-Santini PP. Role of interictal epileptiform abnormalities in cognitive impairment. Epilepsy Behav. 2006;8:504–515. - PubMed
    1. Lambert I, Tramoni-Negre E, Lagarde S, et al. . Hippocampal interictal spikes during sleep impact long-term memory consolidation. Ann Neurol. 2020;87:976–987. - PubMed

Publication types