. 2023 Mar 1;136(5):jcs260175.
doi: 10.1242/jcs.260175. Epub 2022 Sep 30.

Kinesin-1 transports morphologically distinct intracellular virions during vaccinia infection

Affiliations

Kinesin-1 transports morphologically distinct intracellular virions during vaccinia infection

Amadeus Xu et al. J Cell Sci. .

Abstract

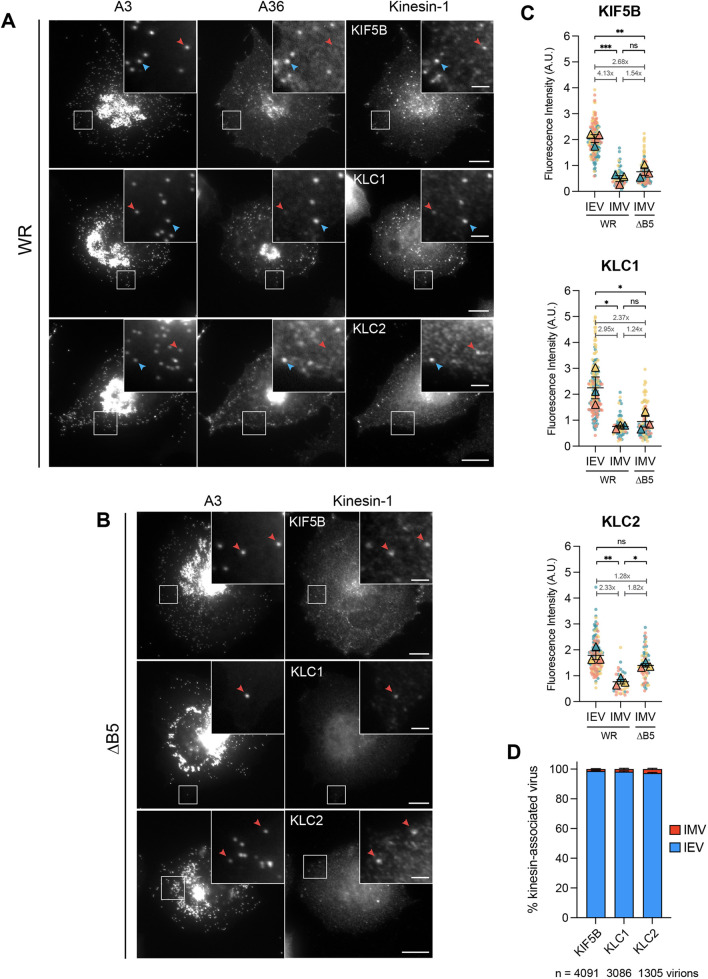
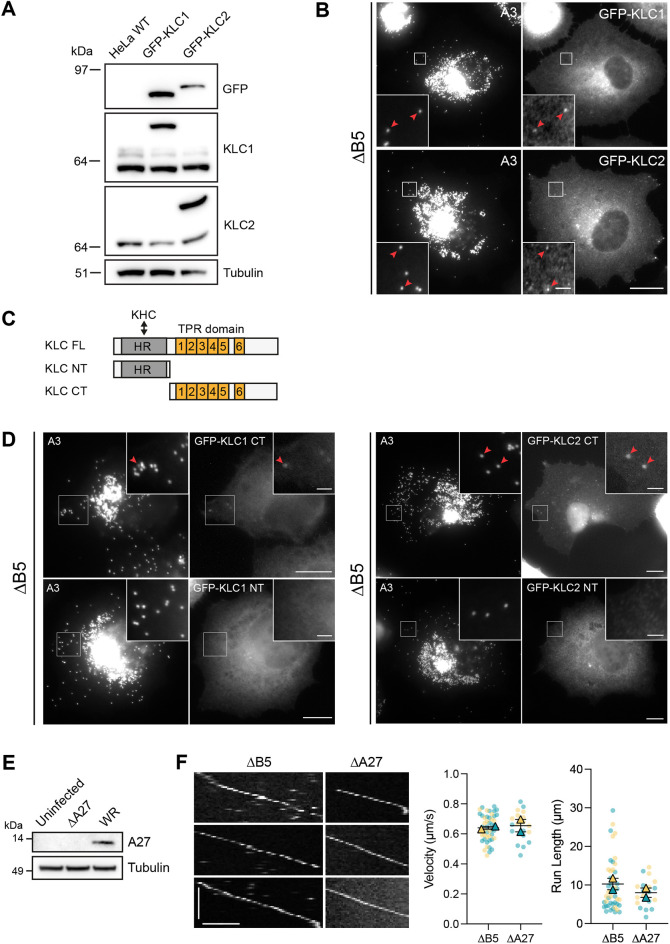
Intracellular mature viruses (IMVs) are the first and most abundant infectious form of vaccinia virus to assemble during its replication cycle. IMVs can undergo microtubule-based motility, but their directionality and the motor involved in their transport remain unknown. Here, we demonstrate that IMVs, like intracellular enveloped viruses (IEVs), the second form of vaccinia that are wrapped in Golgi-derived membranes, recruit kinesin-1 and undergo anterograde transport. In vitro reconstitution of virion transport in infected cell extracts revealed that IMVs and IEVs move toward microtubule plus ends with respective velocities of 0.66 and 0.56 µm/s. Quantitative imaging established that IMVs and IEVs recruit an average of 139 and 320 kinesin-1 motor complexes, respectively. In the absence of kinesin-1, there was a near-complete loss of in vitro motility and reduction in the intracellular spread of both types of virions. Our observations demonstrate that kinesin-1 transports two morphologically distinct forms of vaccinia. Reconstitution of vaccinia-based microtubule motility in vitro provides a new model to elucidate how motor number and regulation impacts transport of a bona fide kinesin-1 cargo.

Keywords: In vitro motility assays; Kinesin-1; Microtubule transport; Vaccinia virus.


Conflict of interest statement

Competing interests M.W. is the Editor-in-Chief at Journal of Cell Science but was not included in any aspect of the editorial handling of this article or the peer review process. The remaining authors declare no competing or financial interests.

Figures

Fig. 1.
Fig. 1.
IMVs undergo microtubule-based motility in cells. (A) A representative image from a time-lapse movie showing a HeLa cell labelled with SiR-tubulin (green) at 7.5 h post infection with the ΔB5 RFP–A3 virus (magenta) to visualise microtubules and IMVs, respectively (see Movie 1). The asterisk indicates the perinuclear site of IMV assembly. Coloured boxed regions are enlarged in B. The maximum-intensity projection of the IMV channel over 90 s is shown on the right. Scale bar: 20 µm. (B) Enlarged boxed regions from A illustrate examples of processive, diffusive and stationary IMV (magenta) movements on microtubules (green) (see Movie 2). The time in seconds is indicated. The corresponding kymographs (shown on the right) for each IMV motion over 90 s were generated from the dotted lines as indicated. Scale bar: 2 µm (left). (C) Representative immunofluorescence images showing the organisation of microtubules using an anti-tubulin antibody in HeLa cells infected with the ΔB5 virus for 7.5 h and treated with DMSO or 33 µM nocodazole for 1 h. Scale bar: 10 µm. (D) Representative maximum-intensity projection images showing the movement of IMVs in HeLa cells infected with ΔB5 RFP–A3 for 7 h and treated with DMSO or 33 µM nocodazole for 1 h prior to imaging. IMV movement over 60 s is indicated by the timestamp bar (see Movie 3). Scale bar: 10 µm. (E) SuperPlot quantifying the numbers of motile IMVs (defined as IMVs travelling >3 µm) during the 60 s imaging window in infected cells treated with DMSO or 33 µM nocodazole for 1 h. n=34 cells per condition from three independent experiments. Data show the mean±s.e.m. Two-tailed unpaired Student's t-test was used to determine statistical significance. ***P≤0.001.
Fig. 2.
Fig. 2.
Analysis of microtubule-based motility of IMVs in cells. (A) Schematic of the image acquisition and analysis pipeline used to track virions and categorise their constituent movements as either active motion, normal diffusion, sub-diffusion or confined using Trackmate and TraJ. (B) Histograms of the velocities and run lengths of IMVs and IEVs undergoing active motion using automated tracking and analysis. n=7842 IMV and 2518 IEV runs from 15 ΔB5- and 22 WR-infected cells, respectively, from three independent experiments. Values show the mean±s.d.
Fig. 3.
Fig. 3.
Analysis of microtubule-based IMV and IEV movements in vitro. (A) Schematic of an in vitro flow chamber illustrating the attachment of biotin-labelled and fluorescently labelled microtubules to a biotin–PEG-functionalised glass coverslip via a neutravidin link. RFP-tagged IMVs were visualised following addition of infected cell extracts into the chamber. (B) Schematic of the intracellular virions produced by wild-type Western Reserve (WR) or recombinant ΔB5 strains. Intracellular mature virions (IMVs) were labelled by RFP–A3 only, whereas intracellular enveloped virions (IEVs) were identified by RFP–A3 and A36–YFP markers. (C) Example kymographs of IMV or IEV movements on GMPCPP-stabilised microtubules (cyan) in the presence of 2 mM ATP or AMPPNP (see Movies 4 and 5). Scale bars: 30 s (vertical) and 5 µm (horizontal). (D) SuperPlots showing IMV and IEV in vitro motility rate in the presence of ATP or AMPPNP, and IMV and IEV velocities and run lengths in the presence of ATP. Error bars represent the mean±s.e.m. from three independent experiments in which 146 IMVs and 259­­ IEVs were analysed. (E) Pie charts showing the percentage of IMVs or IEVs that translocated to the end of the microtubule (MT). The percentage of virions that did not reach the end, or their fates were not discernible (N.D.) are also indicated. (F) Kymographs showing IMV and IEV movement along the same microtubule (MT) in vitro using extracts from HeLa cells infected with WR A36-YdF–YFP RFP–A3. Bar graph (right) shows the percentage of motile IMVs and IEVs. n=274 virus runs from three independent experiments. Scale bars: 30 s (vertical) and 10 μm (horizontal). (G) Kymographs of IMVs or IEVs moving on polarity-marked microtubules (cyan) in vitro (see Movies 6 and 7). Microtubule plus (+) and minus (−) ends are indicated below the images. The bar graph (right) shows the percentage of IMVs and IEVs moving towards microtubule (+) or (−) ends. n=98 IMVs or 120 IEVs from three independent experiments. Scale bars: 30 s (vertical) and 5 µm (horizontal).
Fig. 4.
Fig. 4.
IMVs and IEVs recruit endogenous kinesin-1 in infected cells. (A,B) Representative immunofluorescence images of HeLa cells infected with (A) WR RFP–A3 or (B) ΔB5 RFP–A3 viruses and labelled with antibodies against A36 and/or KIF5B (top panels), KLC1 (middle panels) or KLC2 (bottom panels) 7.5 h post infection. Boxed regions highlight IEVs (blue arrowheads) or IMVs (red arrowheads) associated with kinesin-1. Scale bars: 10 µm and 2 µm (inset). (C) SuperPlots showing background-subtracted fluorescence intensities of antibodies against KIF5B, KLC1 or KLC2 associated with IEVs or IMVs in WR- or ΔB5-infected HeLa cells 7.5 h post infection. The fold differences between the means of each dataset are indicated. Error bars represent mean±s.e.m. from three independent experiments (n=33–174 measurements for each condition). Tukey's multiple comparison test was used to determine statistical significance. A.U., arbitrary units. ns, not significant, P>0.05; *P≤0.05; **P≤0.01; ***P≤0.001. (D) Bar graph showing the percentage of KIF5B-, KLC1- or KLC2-associated virions in WR-infected cells that were either IEVs or IMVs. Error bars represent mean±s.e.m. from three independent experiments. n=1305–4091 kinesin-associated virions from 32–35 cells.
Fig. 5.
Fig. 5.
IMVs recruit kinesin via the KLC TPR domains. (A) Immunoblot analyses with the indicated antibodies of total cell lysates from parental HeLa wild-type (WT) or HeLa cells stably expressing of GFP-KLC1 or GFP-KLC2. (B) Representative immunofluorescence images showing HeLa cells stably expressing GFP-tagged KLC1 or KLC2 and infected with the ΔB5 RFP–A3 virus. Red arrowheads highlight IMV colocalisation with KLC. Scale bars: 10 µm and 2 µm (inset). (C) Schematic of KLC full length (FL), N-terminal (NT) and C-terminal (CT) constructs. The NT contains the heptad repeat (HR) domain, which binds kinesin heavy chain (KHC), whereas the CT contains the tetratricopeptide repeat (TPR) domain involved in cargo binding. (D) Representative immunofluorescence images showing HeLa cells transiently expressing the indicated GFP-tagged KLC construct and infected with ΔB5 RFP–A3 for 7.5 h. Insets show IMV colocalisation (red arrowheads) with the C-terminal (CT) domains of GFP-KLC1 and -KLC2 but not their N-terminal (NT) domain. Scale bars: 10 μm and 2 μm (inset). (E) Immunoblot analyses of whole-cell lysates from uninfected, ΔA27- or WR-infected HeLa cells using the indicated antibodies. (F) Example kymographs showing in vitro IMV motility in extracts derived from cells infected with ΔB5 RFP–A3 (left) or ΔA27 YFP–A4 (right) viruses. Scale bars: 20 s (vertical) and 5 μm (horizontal). The corresponding SuperPlots show IMV velocities and run lengths using these two virus strains. Bars represent mean±s.e.m. n=46 (ΔB5) or 19 (ΔA27) virions from two independent experiments. All images are representative of two independent experiments.
Fig. 6.
Fig. 6.
Loss of kinesin-1 impairs IMV and IEV spread and motility. (A) Schematic illustrating the area corresponding to the peripheral region <5 μm from the cell edge (teal) and non-peripheral area (pink) >5 µm from the cell edge. IMVs within each region were counted to determine the total number and proportion of IMVs reaching the cell periphery 7.5 h post infection. (B) Representative inverted immunofluorescence images showing dispersion of IMVs, labelled with an antibody detecting the IMV membrane protein A27, in the indicated cell lines at 7.5 h post infection with ΔB5 RFP–A3. Scale bar: 10 µm. (C) SuperPlots showing quantification of the number of peripheral IMVs (left) and the percentage of total IMVs (right) at the cell periphery in the indicated cell lines (KIF5B is indicated as 5B) from >50 cells in three independent experiments. Error bars represent the mean±s.e.m. Dunnett’s multiple comparisons test was used to determine statistical significance. (D) Illustration showing the accumulation of IEVs at the perinuclear region and cell vertices (shaded green, left cell) or lack of accumulation at the cell vertices (shaded pink, right cell). (E) Representative inverted immunofluorescence images labelled with the indicated markers showing IEV spread in the indicated cell lines 7.5 h post infection with WR A36-YdF RFP–A3 virus and labelled with anti-A36 antibody. The arrowheads indicate the accumulation of IEVs at cell peripheries. Scale bar: 10 µm. (F) Bar graphs showing the percentages of cells with peripheral IEV accumulation (left) and quantification of IEV spread to the cell periphery (right) based on fluorescence intensity of the anti-A36 antibody. Error bars represent mean±s.e.m. from >50 cells in three independent experiments. Tukey's multiple comparisons test was used to determine statistical significance. A.U., arbitrary units. (G) SuperPlots of the in vitro motility rates, velocities and run lengths for IMVs (n=116, 18 and 48) and IEVs (n=227, 23 and 124) in extracts of the indicated infected cells. Error bars represent mean±s.e.m. from three independent experiments. Tukey's multiple comparisons test was used to determine statistical significance. ns, not significant, P>0.05; *P≤0.05; **P≤0.01; ***P≤0.001; ****P≤0.0001.
Fig. 7.
Fig. 7.
Quantifying the number of kinesin-1 complexes on IMVs and IEVs. (A) Schematic of the intracellular TagGFP2-tagged 60-mer nanocage. Each subunit of the nanocage (grey) is fused with TagGFP2 (green) and FKBP (blue), although this is shown only for one subunit for clarity. FRB (pink) is targeted to the plasma membrane by its palmitoylation and myristoylation sequence and dimerises with FKBP in the presence of the rapamycin analogue AP21967. PDB structures used: 5KP9, 2Y0G and 4DRI. (B) Representative average-intensity projection images of transiently expressed TagGFP2-tagged nanocages in HeLa cells treated with 500 nM AP21967. Scale bar: 2 µm. (C) Quantification of fluorescence intensities of TagGFP2-tagged 24-, 60-, 120- and 180-mer nanocages. Error bars represent mean±s.d. Linear line of regression is fitted. n=51–114 measurements per nanocage from three independent experiments. (D) Immunoblot analysis of total cell lysates from HeLa wild-type (WT) or TagGFP2–KIF5B CRISPR knock-in (KI) cells using the indicated antibodies. (E) Representative images from time-lapse movie showing the association of kinesin-1 (green) with IMVs (magenta) during moving (red arrowheads) and stationary (blue arrowheads) phases in the HeLa TagGFP2–KIF5B knock-in cell line at 7.5 h post infection with the ΔB5 RFP–A3 virus (see Movie 8). Time in seconds is indicated in each image. Scale bar: 2 µm. The graph on the right shows quantification of the TagGFP2–KIF5B:RFP–A3 fluorescence intensity ratio on IMV particles during moving and stationary phases. n=11 virions from two independent experiments. (F) Representative average-intensity projections of endogenously expressed TagGFP2–KIF5B (green) on IEVs or IMVs (magenta) in HeLa TagGFP2–KIF5B knock-in cells 7.5 h post infection with ΔB5 RFP–A3 (left) or WR B5-RFP (right). Scale bar: 2 µm. (G) The left graph shows the mean background-subtracted fluorescence intensity of TagGFP2–KIF5B together with the calculated number of molecules on IMVs and IEVs, superimposed (dotted red lines) on the nanocage calibration plot from C. The table below shows the summary of the readout. SuperPlot (right) showing the number of kinesin-1 complexes associated with IMVs or IEVs from three independent experiments in which 84 and 121 virions were analysed for IMVs and IEVs, respectively. Bars represent mean±s.e.m. Two-tailed unpaired ­Student's t-test was used to determine statistical significance. **P≤0.01. (H) SuperPlots showing the background-subtracted antibody intensity signals of KIF5B associated with IMVs (left graph) or IEVs (right graph) in HeLa wild-type (WT) or tagGFP2–KIF5B knock-in (KI) cells. The fold difference between the mean number of KIF5B associated with virions in WT or KI cells is shown. The table summarises the mean number of kinesin-1 complexes associated with IMVs or IEVs in HeLa WT or KI cells after correcting for low levels of tagGFP2–KIF5B expression in the latter. a.u., arbitrary units.
Fig. 8.
Fig. 8.
Super-resolution imaging of kinesin-1 associated with virus particles. (A) Maximum-intensity projections of deconvolved super-resolution images of a HeLa cell infected with ΔB5 RFP–A3 (upper panel) or WR RFP–A3 (lower panel) and immunolabelled for KIF5B (green) and either A27 (blue) or A36 (blue) as indicated. Boxed regions are enlarged on the right, along with the corresponding xz and yz orthogonal views. Dotted lines show the cross-section used. Scale bars: 10 µm and 1 µm (insets). (B) Maximum-intensity projections showing additional examples in which kinesin-1 (green), detected with the anti-KLC1 antibody, is present on IMVs and IEVs (magenta) at 7.5 h post infection with ΔB5 RFP–A3 or WR RFP–A3. Scale bar: 1 µm. Images are representative of two experiments.

Similar articles

Cited by

References

    1. Abella, J. V. G., Galloni, C., Pernier, J., Barry, D. J., Kjaer, S., Carlier, M.-F. and Way, M. (2016). Isoform diversity in the Arp2/3 complex determines actin filament dynamics. Nat. Cell Biol. 18, 76-86. 10.1038/ncb3286 - DOI - PubMed
    1. Akamatsu, M., Vasan, R., Serwas, D., Ferrin, M. A., Rangamani, P. and Drubin, D. G. (2020). Principles of self-organization and load adaptation by the actin cytoskeleton during clathrin-mediated endocytosis. eLife 9, e49840. 10.7554/eLife.49840 - DOI - PMC - PubMed
    1. Arakawa, Y., Cordeiro, J. V., Schleich, S., Newsome, T. P. and Way, M. (2007). The release of vaccinia virus from infected cells requires RhoA-mDia modulation of cortical actin. Cell Host Microbe 1, 227-240. 10.1016/j.chom.2007.04.006 - DOI - PubMed
    1. Ashkin, A., Schütze, K., Dziedzic, J. M., Euteneuer, U. and Schliwa, M. (1990). Force generation of organelle transport measured in vivo by an infrared laser trap. Nature 348, 346-348. 10.1038/348346a0 - DOI - PubMed
    1. Beeg, J., Klumpp, S., Dimova, R., Gracià, R. S., Unger, E. and Lipowsky, R. (2008). Transport of beads by several kinesin motors. Biophys. J. 94, 532-541. 10.1529/biophysj.106.097881 - DOI - PMC - PubMed

Publication types