. 2022 Oct 1;135(19):jcs260185.
doi: 10.1242/jcs.260185. Epub 2022 Oct 5.

Distinct roles of the Chlamydia trachomatis effectors TarP and TmeA in the regulation of formin and Arp2/3 during entry

Affiliations

Distinct roles of the Chlamydia trachomatis effectors TarP and TmeA in the regulation of formin and Arp2/3 during entry

Matthew D Romero et al. J Cell Sci. .

Abstract

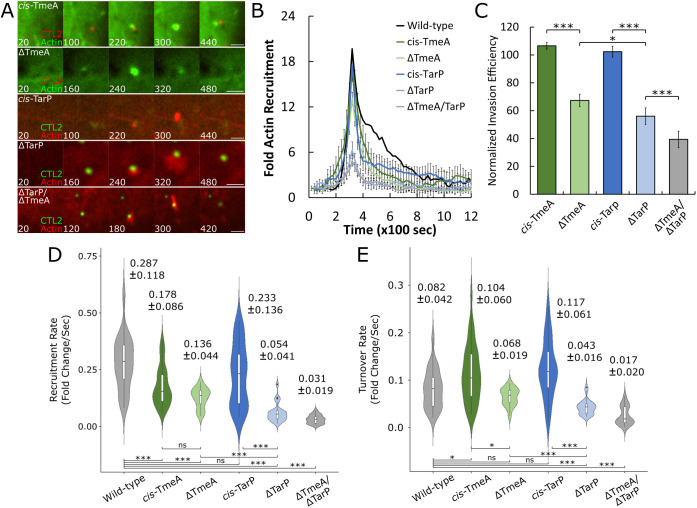
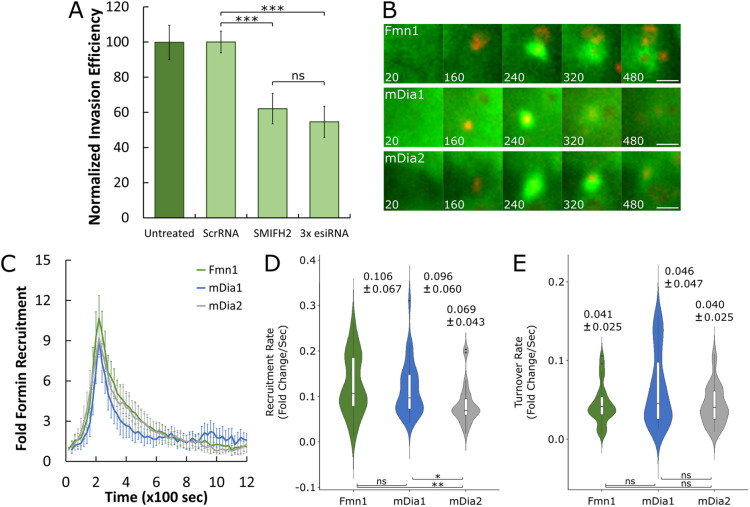
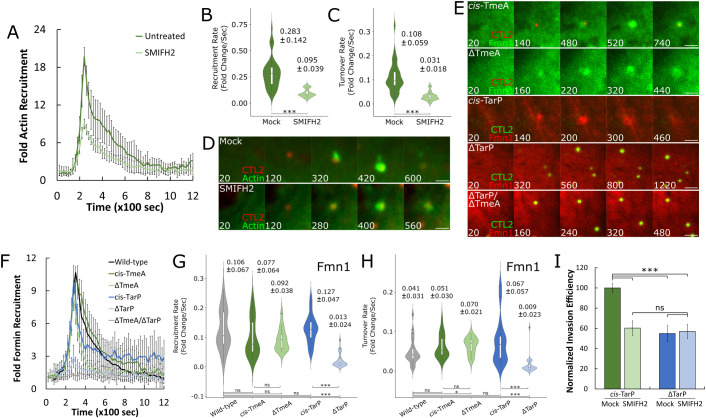
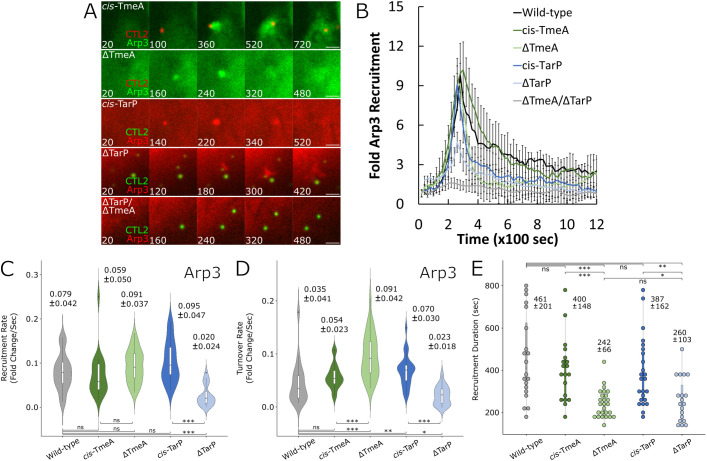
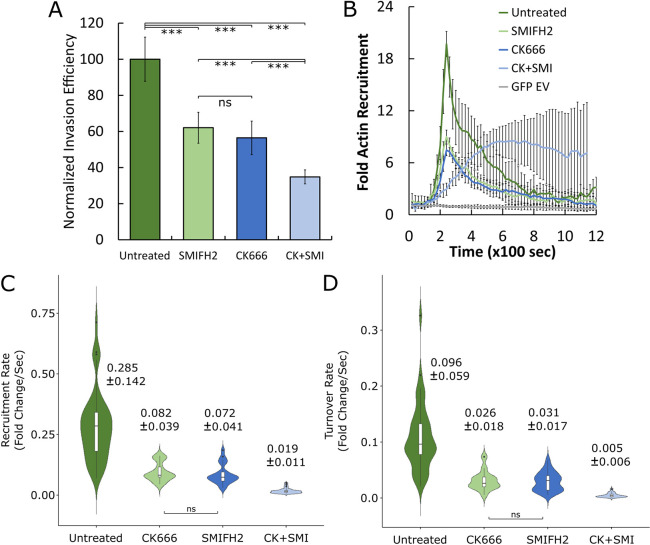
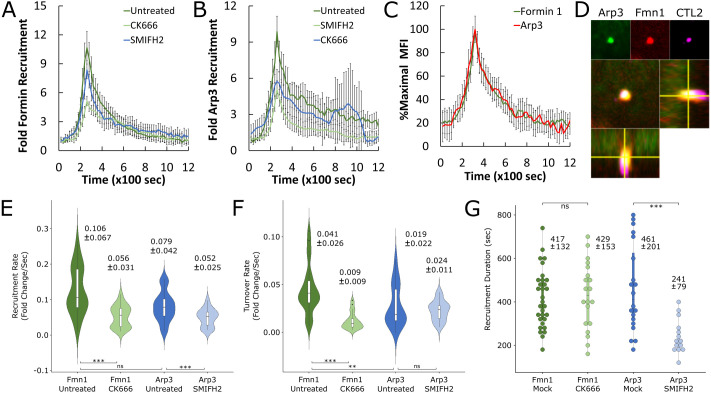
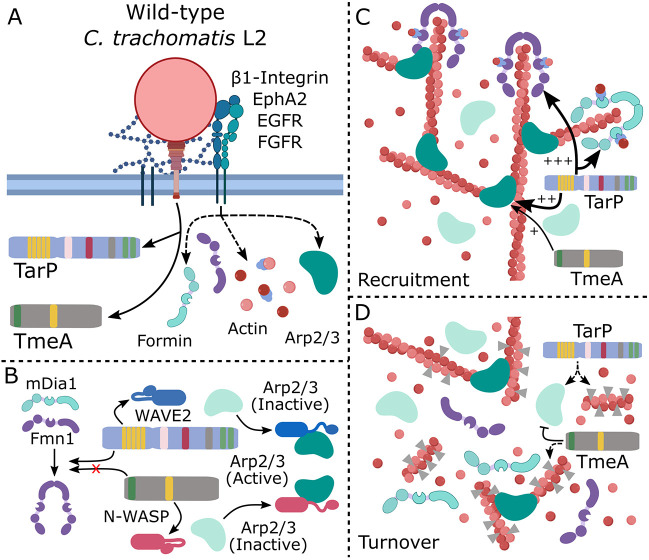
The obligate intracellular pathogen Chlamydia trachomatis manipulates the host actin cytoskeleton to assemble actin-rich structures that drive pathogen entry. The recent discovery of TmeA, which, like TarP, is an invasion-associated type III effector implicated in actin remodeling, raised questions regarding the nature of their functional interaction. Quantitative live-cell imaging of actin remodeling at invasion sites revealed differences in recruitment and turnover kinetics associated with the TarP and TmeA pathways, with the former accounting for most of the robust actin dynamics at invasion sites. TarP-mediated recruitment of actin nucleators, i.e. formins and the Arp2/3 complex, was crucial for rapid actin kinetics, generating a collaborative positive feedback loop that enhanced their respective actin-nucleating activities within invasion sites. In contrast, the formin Fmn1 was not recruited to invasion sites and did not collaborate with Arp2/3 within the context of TmeA-associated actin recruitment. Although the TarP-Fmn1-Arp2/3 signaling axis is responsible for the majority of actin dynamics, its inhibition had similar effects as the deletion of TmeA on invasion efficiency, consistent with the proposed model that TarP and TmeA act on different stages of the same invasion pathway.

Keywords: Chlamydia invasion; Actin kinetics; Formin; TarP; TmeA.


Conflict of interest statement

Competing interests The authors declare no competing or financial interests.

Figures

Fig. 1.
Fig. 1.
Deletion of TarP and TmeA impairs invasion and attenuates kinetics of actin recruitment and turnover. (A,B) Cos7 cells were transfected with GFP–actin or mRuby–LifeAct for 24 h prior to infection with wild-type, single-knockout (ΔTarP, ΔTmeA), cis-complemented (cis-TarP, cis-TmeA) or double-knockout (ΔTmeA/ΔTarP) Chlamydia trachomatis serovar L2 (CTL2) strains at a multiplicity of infection (MOI) of 20. Infection was monitored by live-cell confocal microscopy using a Nikon CSU-W1 spinning disk microscope, obtaining images every 20 s for 30 min to identify sites exhibiting actin recruitment. Scale bars: 2 μm. (B) Fluorescence intensity of actin recruitment events was quantified for each strain and normalized as fold recruitment above basal actin fluorescence. Detailed visualization of this process can be found in Fig. S1. Data are displayed as the mean fold recruitment for each timepoint ±s.e.m. compiled from a minimum of n=18 recruitment events. (C) HeLa cells were infected with each Chlamydia strain indicated above at an MOI of 50 and stained using the invasion assay method described in the Materials and Methods. Results were normalized against the mean invasion efficiency of wild-type Chlamydia and plotted as normalized mean±s.e.m. Data were collected from 15 fields, with each field containing an average of 100 chlamydiae. Statistical significance was determined by pairwise two-tailed, unpaired t-test with Bonferroni correction. (D,E) Actin recruitment events were individually divided into recruitment and turnover phases (Fig. S3). Individual rates of (D) recruitment and (E) turnover were plotted on a violin plot with an inset boxplot, reporting the median rate±s.d. for each strain tested. Violin plots contain a minimum of n=18 individual rates. Statistical significance was determined by Wilcoxon rank-sum test. All data are representative of at least three independent experiments. ns, not significant; *P≤0.05; ***P≤0.001.
Fig. 2.
Fig. 2.
Multiple formin species are recruited during invasion and promote Chlamydia internalization. (A) HeLa cells were transfected with scrambled RNA (ScrRNA) or a pooled mixture of esiRNAs (3× esiRNA, 100 ng each) directed against FMN1, DIAPH1 (mDia1) and DIAPH3 (mDia2) for 48 h prior to infection with wild-type C. trachomatis elementary bodies at an MOI of 50. Concurrently, HeLa cells were mock-treated or treated with the pan-formin inhibitor SMIFH2 (10 µM) for 1 h prior to infection (MOI=50). Infected cells were stained using the method described earlier (Fig. 1C). Results were normalized against mean invasion efficiency of mock-treated Chlamydia and plotted as normalized mean±s.e.m. Data were collected from 15 fields, with each field containing an average of 100 chlamydiae. Statistical significance was determined by pairwise two-tailed, unpaired t-test with Bonferroni correction. (B,C) Cos7 cells were transfected with GFP–Fmn1, mEmerald–mDia1 or mEmerald–mDia2 for 24 h prior to infection with red-fluorescent (CMTPX) wild-type CTL2 at an MOI of 20. The infection was monitored by live-cell confocal microscopy, obtaining images every 20 s for 30 min, measuring protein recruitment using the method described earlier (Fig. 1B). Data were plotted as the mean fold recruitment for each timepoint ±s.e.m. compiled from a minimum of n=15 recruitment events. Scale bars: 2 μm. (D,E) Recruitment and turnover kinetics were analyzed for Fmn1, mDia1 and mDia2 using the same methodology described in Fig. 1D,E. Violin plots contain a minimum of n=15 individual rates, reporting the median rate±s.d. Statistical significance was determined by Wilcoxon rank-sum test. All data are representative of at least three independent experiments. ns, not significant; *P≤0.05; **P≤0.01; ***P≤0.001.
Fig. 3.
Fig. 3.
TarP-dependent recruitment of formin is required for rapid actin kinetics. (A,D) Cos7 cells were transfected with GFP–actin for 24 h prior to application of the pan-formin inhibitor SMIFH2 (10 µM) or mock DMSO control for 1 h, followed by infection with wild-type CMTPX-CTL2 at an MOI of 20. Infection was monitored by live-cell confocal microscopy using methods described earlier (Fig. 1A,B), plotting the mean fold recruitment for each timepoint ±s.e.m. compiled from a minimum of n=16 recruitment events. Scale bars: 2 μm. (B,C) Actin recruitment and turnover kinetics of mock- and SMIFH2-treated groups were analyzed using the method described in Fig. 1D,E. Violin plots contain a minimum of n=16 individual rates, reporting the median rate±s.d. (E,F) Cos7 cells were transfected with Fmn1–GFP or Fmn1–mCherry for 24 h prior to infection with the indicated CTL2 strains at an MOI of 20. Infection was monitored by live-cell confocal microscopy using methods described earlier to identify sites exhibiting Fmn1 recruitment. Scale bars: 2 μm. Fluorescence intensity of Fmn1 recruitment was plotted as the mean fold recruitment for each timepoint ±s.e.m. compiled from a minimum of n=17 recruitment events. (G,H) Kinetics of Fmn1 recruitment and turnover were analyzed for each strain indicated above using the method described earlier. Violin plots contain a minimum of n=17 individual rates, reporting the median rate±s.d. Statistical significance was determined by Wilcoxon rank-sum test. (I) HeLa cells were infected with either cis-TarP or ΔTarP EBs at an MOI of 50 and stained using the method described earlier (Fig. 1C). Results were normalized against the mean invasion efficiency of cis-TarP EBs and plotted as normalized mean±s.e.m. Data were collected from 15 fields, with each field containing an average of 85 chlamydiae. Statistical significance was determined by pairwise two-tailed, unpaired t-test with Bonferroni correction. All data are representative of at least three independent experiments. ns, not significant; *P≤0.05; ***P≤0.001.
Fig. 4.
Fig. 4.
Arp3 recruitment and turnover are dependent on TarP and TmeA, respectively. (A,B) Cos7 cells were transfected with Arp3–GFP or Arp3–mCherry for 24 prior to infection with the indicated CTL2 strains at an MOI of 20. Infection was monitored as described earlier (Fig. 1A). Scale bars: 2 μm. (B) Fluorescence intensity of Arp3 recruitment was measured as described earlier (Fig. 1B) and plotted as the mean fold recruitment for each timepoint ±s.e.m. compiled from a minimum of n=12 recruitment events. (C,D) Kinetics of Arp3 recruitment and turnover were analyzed for each strain using the same method described in Fig. 1D,E. Violin plots contain a minimum of n=12 individual rates, reporting the median rate±s.d. (E) Recruitment duration was calculated for each recruitment event, representing the time elapsed from start of recruitment to the end of fast turnover using the criteria described in Fig. S3, and plotted onto a dot plot with inset box plot. Statistical significance was determined by Wilcoxon rank-sum test. All data are representative of at least three independent experiments. ns, not significant; *P≤0.05; **P≤0.01; ***P≤0.001.
Fig. 5.
Fig. 5.
The activity of formin and Arp2/3 is necessary for efficient invasion and optimal actin recruitment kinetics. (A) HeLa cells were mock-treated or pretreated with inhibitors against formin (10 µM SMIFH2), Arp2/3 (100 µM CK666) or both (CK+SMI) for 1 h, infected with C. trachomatis serovar L2 at an MOI of 50 and stained as described previously. Results were normalized against the mean invasion efficiency of mock-treated cells and plotted as normalized mean±s.e.m. Data were collected from 20 fields, with each field containing an average of 108 chlamydiae. Statistical significance was determined by pairwise two-tailed, unpaired t-test with Bonferroni correction. (B) Cos7 cells were transfected with GFP–actin or a GFP empty vector (EV) for 24 h prior to mock treatment or pretreatment with 10 µM SMIFH2, 100 µM CK666 or both for 1 h. Transfected cells were infected with CMTPX-Chlamydia at an MOI of 20 and monitored by live-cell confocal microscopy using methods described earlier (Fig. 1A,B), plotting the mean fold recruitment for each timepoint ±s.e.m. compiled from a minimum of n=16 recruitment events. (C,D) Kinetics of GFP–actin recruitment and turnover were analyzed for each condition using the same method described in Fig. 1D,E. Violin plots contain a minimum of n=16 individual rates, reporting the median rate±s.d. Statistical significance was determined by Wilcoxon rank-sum test. All data are representative of at least three independent experiments. ns, not significant; ***P≤0.001.
Fig. 6.
Fig. 6.
Formin 1 and Arp3 collaboration enhances recruitment kinetics at entry sites. (A,B) Cos7 cells were transfected with (A) GFP–formin 1 isoform 1B (GFP–Fmn1) or (B) GFP–Arp3 for 24 h prior to mock treatment or pretreatment with 10 µM SMIFH2 or 100 µM CK666 for 1 h. Quantitative live-cell imaging of CMTPX-Chlamydia (MOI=20) was performed as described previously (Fig. 1B) and plotted as mean fold recruitment±s.e.m. of Fmn1 or Arp3 for each timepoint. Data were compiled from a minimum of n=16 recruitment events. (C) Cos7 cells were co-transfected with GFP–Fmn1 and mCherry–Arp3 for 24 h prior to infection with unlabeled C. trachomatis (MOI=20) followed by quantitative live-cell imaging of invasion. Recruitment events were defined as regions containing elevated GFP–Fmn1 fluorescence compared to local background. Fluorescence intensities of GFP–Fmn1 and mCherry–Arp3 were obtained from the same recruitment region of interest, subtracting background fluorescence from GFP and RFP channels independently. Fluorescence intensity was normalized for each channel against their respective maximal MFI, reporting the percentage of the maximum MFI ±s.e.m. for each timepoint. Data were compiled from 33 recruitment events. (D) Cos7 cells were co-transfected with GFP–Arp3 and Fmn1–mCherry for 24 h before synchronized infection with CTL2 (MOI=20). Invasion was halted at 20 min post infection and Chlamydia stained via immunofluorescence. Cells were analyzed by confocal microscopy, obtaining z-stacks of formin and Arp2/3 recruitment at sites of Chlamydia invasion. The middle-right and bottom images show orthogonal views. (E,F) Kinetics of Fmn1 and Arp3 recruitment and turnover were analyzed in the presence and absence of 100 µM CK666 or 10 µM SMIFH2, respectively, using the method described in Fig. 1D,E. Violin plots contain a minimum of n=16 individual rates, reporting the median rate±s.d. (G) Recruitment duration was calculated for each recruitment event, representing the time elapsed from start of recruitment to the end of fast turnover using the criteria described in Fig. S3, and plotted onto a dot plot with an inset box plot. Statistical significance was determined by Wilcoxon rank-sum test. All data are representative of at least three independent experiments. ns, not significant; **P≤0.01; ***P≤0.001.
Fig. 7.
Fig. 7.
Proposed model for collaboration between formin and Arp2/3 and subsequent rapid actin recruitment and turnover. (A) C. trachomatis engages and activates a multitude of host receptors, the activation of which is linked to the recruitment of formin, Arp2/3 and actin in a non-invasion context (Keb et al., 2021; Kim et al., 2011; Stallmann and Hegemann, 2016; Subbarayal et al., 2015). Signals arising from invasion-associated receptor activation might prompt the activation of actin nucleators and contribute to actin remodeling. The extent to which receptor activation contributes to actin kinetics remains unknown. Concurrent with receptor engagement, Chlamydia secretes the effectors TmeA and TarP via the type III secretion system. (B) TmeA and TarP activate Arp2/3 through N-WASP or WAVE2, respectively, whereas formin activity (e.g. Fmn1, mDia1/2) is attributed exclusively to the presence of TarP. (C) TarP signaling, via its ability to robustly recruit both formin and Arp2/3, enhances actin recruitment kinetics and establishes a collaborative interaction between these nucleators within entry sites. TmeA signaling is associated with recruitment of Arp2/3; however, its contribution to the recruitment phase of actin kinetics is minor relative to TarP. (D) In contrast, TmeA signaling serves as a retention factor of Arp2/3, enabling stable association of this nucleator within invasion-associated actin networks. Turnover of actin and its nucleators is regulated by TarP and TmeA signaling, such that abnormally rapid or sluggish turnover was associated with poor invasion efficiency. The precise mechanism by which effector signaling regulates this interaction remains unknown.

Similar articles

Cited by

References

    1. Baarlink, C., Brandt, D. and Grosse, R. (2010). SnapShot: formins. Cell 142, 172, 172.e1. 10.1016/j.cell.2010.06.030 - DOI - PubMed
    1. Bailly, M., Macaluso, F., Cammer, M., Chan, A., Segall, J. E. and Condeelis, J. S. (1999). Relationship between Arp2/3 complex and the barbed ends of actin filaments at the leading edge of carcinoma cells after epidermal growth factor stimulation. J. Cell Biol. 145, 331-345. 10.1083/jcb.145.2.331 - DOI - PMC - PubMed
    1. Bastidas, R. J., Elwell, C. A., Engel, J. N. and Valdivia, R. H. (2013). Chlamydial intracellular survival strategies. Cold Spring Harb. Perspect. Med. 3, a010256. 10.1101/cshperspect.a010256 - DOI - PMC - PubMed
    1. Bierne, H., Gouin, E., Roux, P., Caroni, P., Yin, H. L. and Cossart, P. (2001). A role for cofilin and LIM kinase in Listeria-induced phagocytosis. J. Cell Biol. 155, 101-112. 10.1083/jcb.200104037 - DOI - PMC - PubMed
    1. Bleicher, P., Sciortino, A. and Bausch, A. R. (2020). The dynamics of actin network turnover is self-organized by a growth-depletion feedback. Sci. Rep. 10, 6215. 10.1038/s41598-020-62942-8 - DOI - PMC - PubMed

Publication types

MeSH terms